StepMA_Stoch_v3
Download script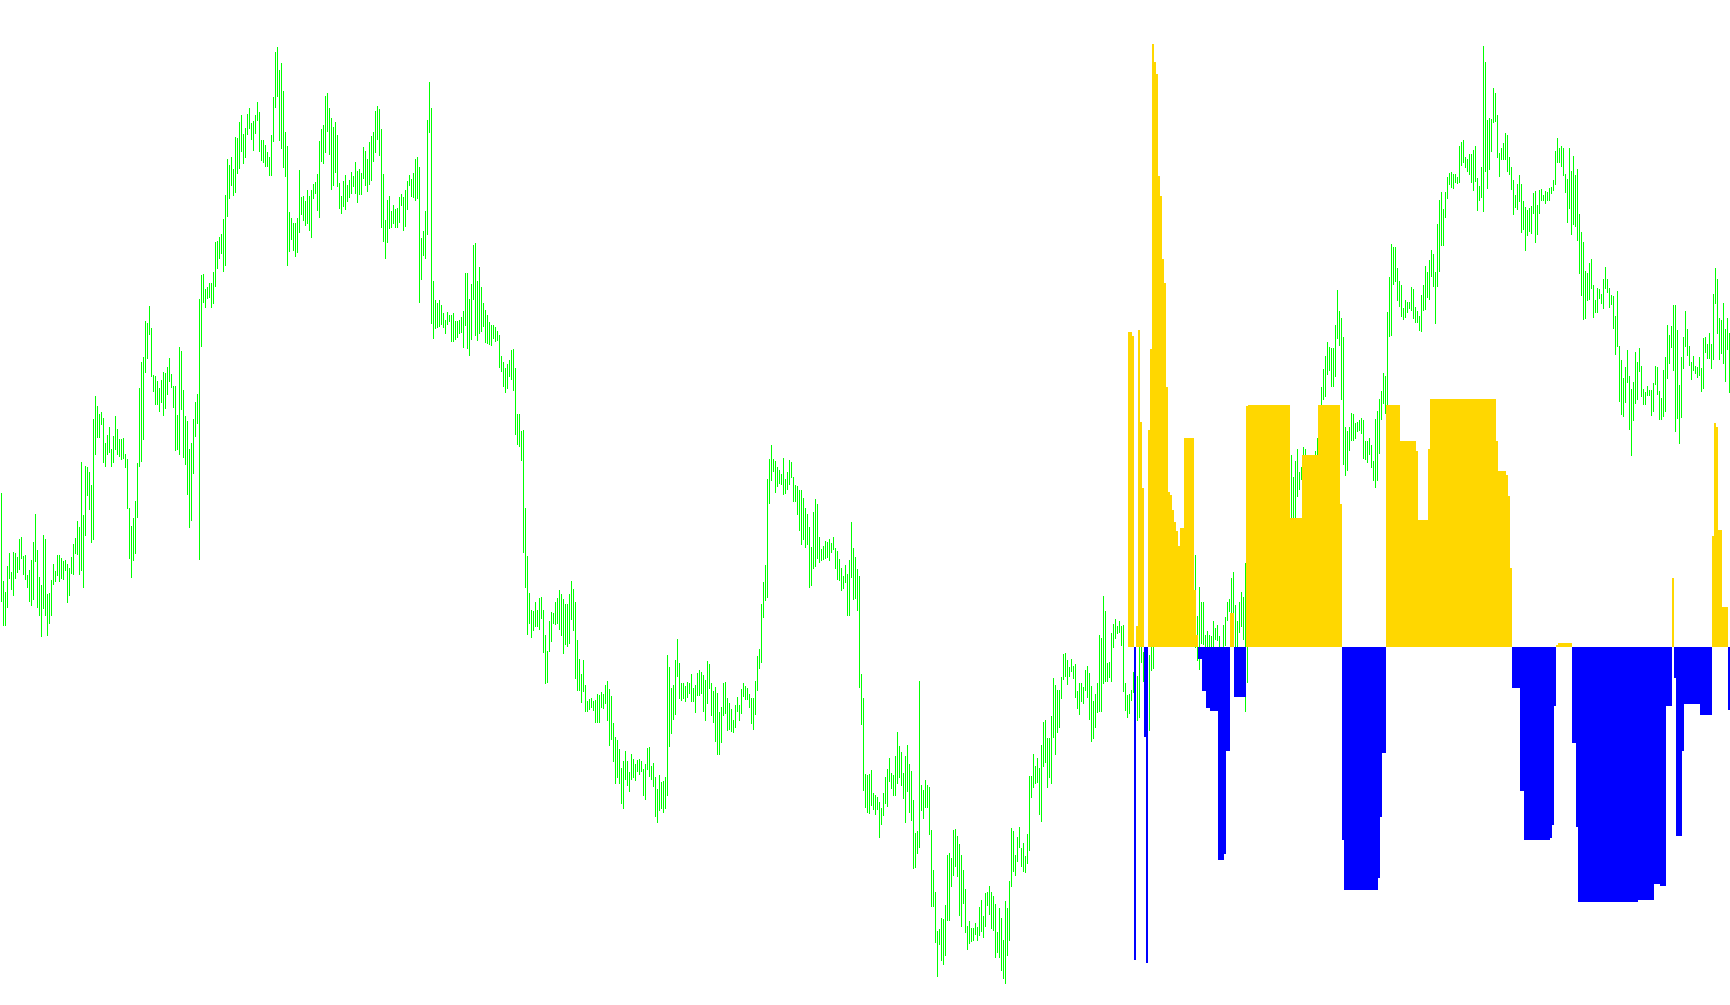
This indicator is designed to analyze and visualize market trends by identifying specific "price steps" and calculating the momentum between different trend intensities. Unlike standard moving averages that smooth out price action, this logic focuses on identifying structural boundaries to determine whether the market is moving in a significant direction.
Core Logic Overview
The script operates by analyzing the relationship between current price action and historical volatility. It works through the following primary stages:
1. Volatility Measurement (WATR Calculation) The script begins by calculating a weighted range of price movement over a specific period. By assigning more weight to recent price data, it establishes a dynamic "volatility zone." This allows the indicator to adapt to different market conditions—expanding during high-activity periods and contracting during quiet consolidation phases.
2. Dynamic Step Definition Based on the volatility calculated above, the script defines three distinct "Step Sizes":
- Minimum: A conservative threshold for small price movements.
- Maximum: A wider threshold for significant market trends.
- Midpoint: A balanced threshold between the two.
These steps act as invisible boundaries. The indicator checks whether the current price has broken above or below these boundaries to determine the strength of the prevailing trend.
3. Trend Identification and Memory The script evaluates the current price against these three different step levels simultaneously. It tracks:
- Whether the price is breaking out in a "Minimum" trend (weak momentum).
- Whether it is breaking out in a "Maximum" trend (strong momentum).
- Whether it is hitting a "Midpoint" trend (moderate momentum).
A key feature of this logic is its "memory." It doesn't just look at the current bar; it compares current boundaries against previous ones to ensure that trend directions remain consistent and don't flicker unnecessarily due to minor price noise.
4. Stochastic Momentum Mapping Once the trends are identified, the script converts these price levels into a normalized scale (similar to a Stochastic oscillator). It calculates the distance between the "Minimum" trend line and the "Maximum" trend line.
By comparing the position of the "Midpoint" trend relative to these boundaries, it produces two distinct values:
- Upward Momentum: Represents the strength of the move toward the higher boundary.
- Downward Momentum: Represents the strength of the move toward the lower boundary.
Visual Representation
The final output is displayed as a histogram in a separate window.
- Green Histograms: Indicate positive momentum, where the price is favoring upward movement relative to the identified trend steps.
- Red Histograms: Indicate negative momentum, where the price is favoring downward movement.
By looking at these bars, a user can see not just if the price is moving, but the relative strength and "velocity" of that move compared to the established volatility of the market.
//+------------------------------------------------------------------+
//|                                             StepMA_Stoch_KV1.mq4 |
//|                           Copyright © 2005, TrendLaboratory Ltd. |
//|                                       E-mail: igorad2004@list.ru |
//|                           modified by Kalenzo -> simone@konto.pl |
//|                           modified by raduga  21.04.2006         |
//|                           modified by Mandorr 02.09.2006         |
//+------------------------------------------------------------------+
#property copyright "Copyright © 2005, TrendLaboratory Ltd."

#property indicator_separate_window
#property indicator_buffers 2
#property indicator_width1  2
#property indicator_width2  2
#property indicator_color1  Green
#property indicator_color2  Red
#property indicator_minimum -0.4
#property indicator_maximum 0.4

extern int    PeriodWATR=10;
extern double Kwatr=1;
extern int    HighLow=0;
extern int    NumberOfBarsToCalculate=300;

double BufferUp[];
double BufferDn[];


void init() {
   SetIndexStyle      (0, DRAW_HISTOGRAM, STYLE_SOLID, 2);
   SetIndexStyle      (1, DRAW_HISTOGRAM, STYLE_SOLID, 2);
   SetIndexBuffer     (0, BufferUp);
   SetIndexBuffer     (1, BufferDn);
   SetIndexLabel      (0, "Value");
   SetIndexLabel      (1, "Value");
   SetIndexDrawBegin  (0, PeriodWATR);
   SetIndexDrawBegin  (1, PeriodWATR);
   SetIndexEmptyValue (0,0);
   SetIndexEmptyValue (1,0);
   IndicatorDigits    (Digits);
   IndicatorShortName ("Step MA Stoch");
}


void start() {
   int    i,shift,TrendMin,TrendMax,TrendMid;
   double SminMin0,SmaxMin0,SminMin1,SmaxMin1,SumRange,dK,WATR0,WATRmax,WATRmin,WATRmid;
   double SminMax0,SmaxMax0,SminMax1,SmaxMax1,SminMid0,SmaxMid0,SminMid1,SmaxMid1;
   double linemin,linemax,linemid,Stoch1,Stoch2,bsmin,bsmax;
   double theDelta;
   double prev_y=0, prev_b=0;
   for (shift=NumberOfBarsToCalculate-1; shift>=0; shift--) {
	   SumRange=0;
	   Stoch1 = 0;
	   Stoch2 = 0;
	   for (i=PeriodWATR-1; i>=0; i--) {
         dK = 1+1.0*(PeriodWATR-i)/PeriodWATR;
         SumRange+= dK*(High[i+shift]-Low[i+shift]);
      }
      WATR0=SumRange/PeriodWATR;
      WATRmax=MathMax(WATR0,WATRmax);
      if (shift==NumberOfBarsToCalculate-1-PeriodWATR) WATRmin=WATR0;
      WATRmin=MathMin(WATR0,WATRmin);
      int StepSizeMin=MathRound(Kwatr*WATRmin/Point);
      int StepSizeMax=MathRound(Kwatr*WATRmax/Point);
      int StepSizeMid=MathRound(Kwatr*0.5*(WATRmax+WATRmin)/Point);
      if (HighLow>0) {
         SmaxMin0=Low[shift]+2*StepSizeMin*Point;
         SminMin0=High[shift]-2*StepSizeMin*Point;
         SmaxMax0=Low[shift]+2*StepSizeMax*Point;
         SminMax0=High[shift]-2*StepSizeMax*Point;
         SmaxMid0=Low[shift]+2*StepSizeMid*Point;
         SminMid0=High[shift]-2*StepSizeMid*Point;
         if (Close[shift]>SmaxMin1) TrendMin=1;
         if (Close[shift]<SminMin1) TrendMin=-1;
         if (Close[shift]>SmaxMax1) TrendMax=1;
         if (Close[shift]<SminMax1) TrendMax=-1;
         if (Close[shift]>SmaxMid1) TrendMid=1;
         if (Close[shift]<SminMid1) TrendMid=-1;
      }
      if (HighLow == 0) {
         SmaxMin0=Close[shift]+2*StepSizeMin*Point;
         SminMin0=Close[shift]-2*StepSizeMin*Point;
         SmaxMax0=Close[shift]+2*StepSizeMax*Point;
         SminMax0=Close[shift]-2*StepSizeMax*Point;
         SmaxMid0=Close[shift]+2*StepSizeMid*Point;
         SminMid0=Close[shift]-2*StepSizeMid*Point;
         if (Close[shift]>SmaxMin1) TrendMin=1;
         if (Close[shift]<SminMin1) TrendMin=-1;
         if (Close[shift]>SmaxMax1) TrendMax=1;
         if (Close[shift]<SminMax1) TrendMax=-1;
         if (Close[shift]>SmaxMid1) TrendMid=1;
         if (Close[shift]<SminMid1) TrendMid=-1;
      }
      if (TrendMin>0 && SminMin0<SminMin1) SminMin0=SminMin1;
      if (TrendMin<0 && SmaxMin0>SmaxMin1) SmaxMin0=SmaxMin1;
      if (TrendMax>0 && SminMax0<SminMax1) SminMax0=SminMax1;
      if (TrendMax<0 && SmaxMax0>SmaxMax1) SmaxMax0=SmaxMax1;
      if (TrendMid>0 && SminMid0<SminMid1) SminMid0=SminMid1;
      if (TrendMid<0 && SmaxMid0>SmaxMid1) SmaxMid0=SmaxMid1;
      if (TrendMin>0) linemin=SminMin0+StepSizeMin*Point;
      if (TrendMin<0) linemin=SmaxMin0-StepSizeMin*Point;
      if (TrendMax>0) linemax=SminMax0+StepSizeMax*Point;
      if (TrendMax<0) linemax=SmaxMax0-StepSizeMax*Point;
      if (TrendMid>0) linemid=SminMid0+StepSizeMid*Point;
      if (TrendMid<0) linemid=SmaxMid0-StepSizeMid*Point;
      bsmin=linemax-StepSizeMax*Point;
      bsmax=linemax+StepSizeMax*Point;
      theDelta = bsmax-bsmin;
      if (theDelta!=0) {
         Stoch1=NormalizeDouble((linemin-bsmin)/theDelta,6);
         Stoch2=NormalizeDouble((linemid-bsmin)/theDelta,6);
      }
      prev_y=Stoch1-Stoch2;
      if (prev_y<0) {
         BufferUp[shift]=0;
         BufferDn[shift]=prev_y;
      }
      else if (prev_y>0) {
         BufferUp[shift]=prev_y;
         BufferDn[shift]=0;
      }
      SminMin1=SminMin0;
      SmaxMin1=SmaxMin0;
      SminMax1=SminMax0;
      SmaxMax1=SmaxMax0;
      SminMid1=SminMid0;
      SmaxMid1=SmaxMid0;
   }
}
Comments