StepMA_Stoch_v1a
Download script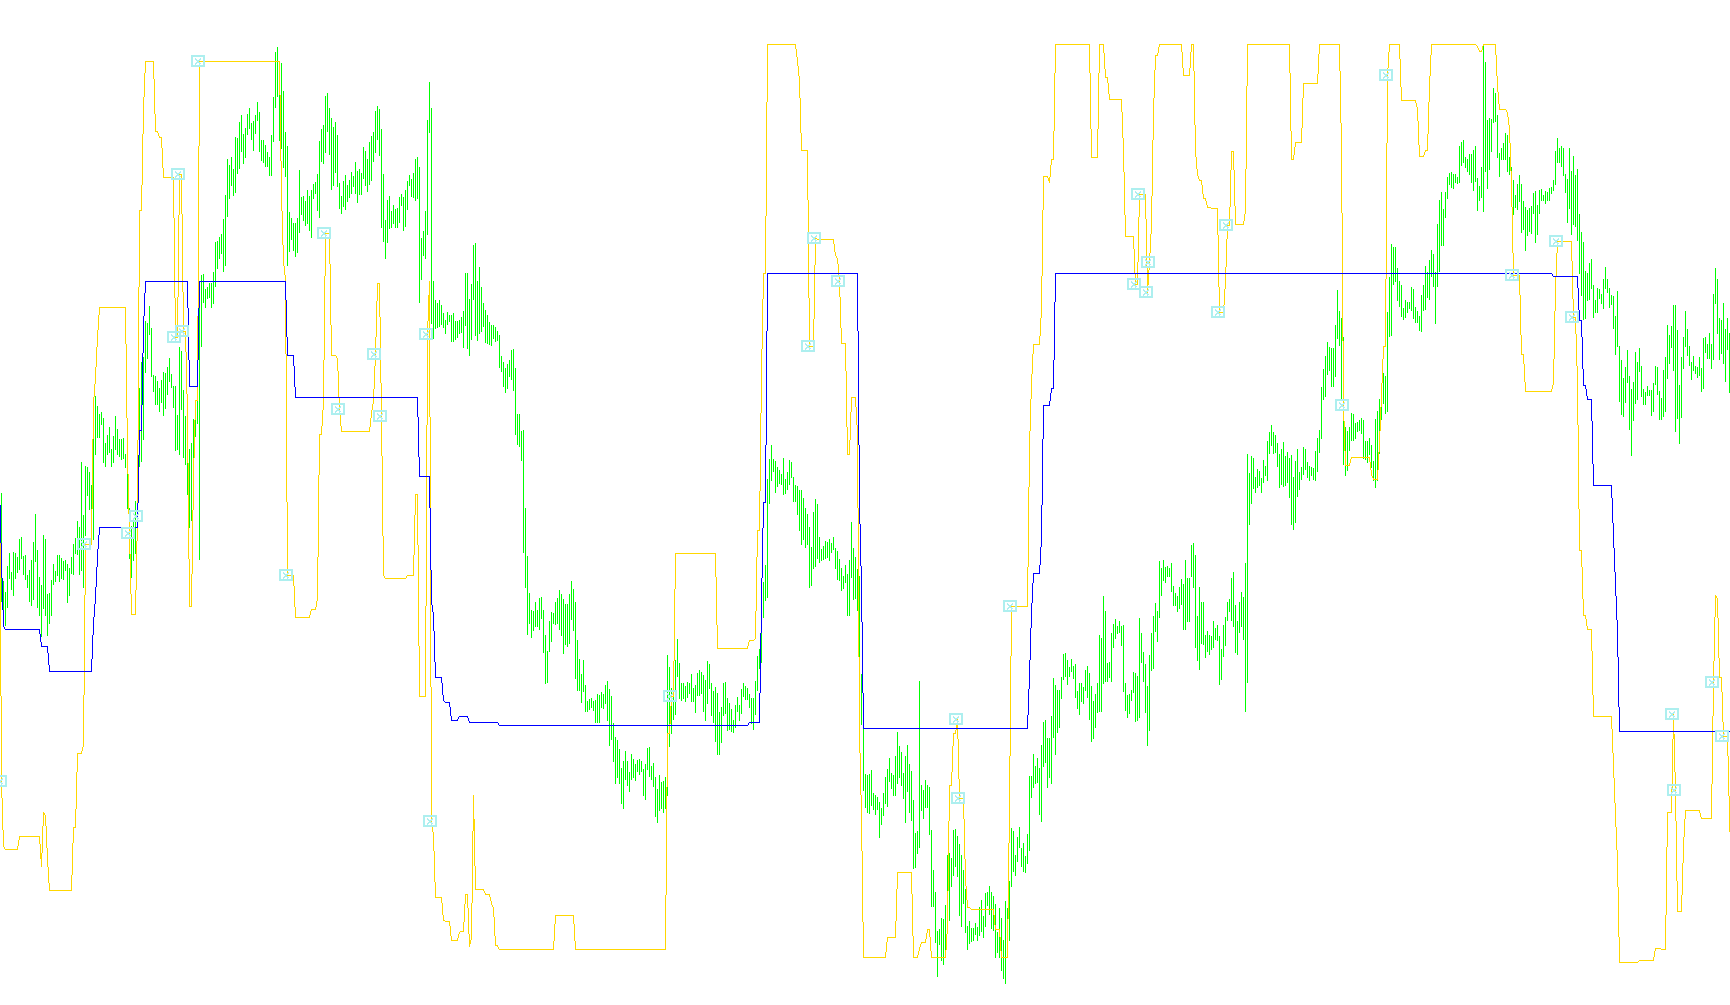
This indicator is designed to help traders visualize and identify market trends by calculating dynamic price boundaries. Rather than simply following the raw price of an asset, it analyzes price volatility and movement over a specific period to create a structured "step" system.
Core Logic Overview
The script operates by measuring the range between high and low prices over a set timeframe. It uses this data to establish three distinct levels of trend sensitivity: Minimum, Maximum, and Mid.
By calculating these levels, the indicator creates a visual representation of where the price is "supposed" to move based on recent history. It essentially builds a framework of boundaries that adapt as the market becomes more or less volatile.
How it Works
1. Volatility Scaling The script first calculates the average range of price movements (the difference between highs and lows). It keeps track of the highest and lowest ranges observed to determine the "Step Size." This ensures that when the market is moving wildly, the indicator's steps widen, and when the market is calm, the steps tighten.
2. Trend Determination The tool evaluates the current price against these calculated boundaries. It checks which "zone" the price is currently occupying:
- It determines if the price is pushing toward the outer limits (Maximum).
- If it is staying within the tighter bounds (Minimum).
- Or if it is hovering in the balanced center (Mid).
3. The "Step" Movement Based on whether the trend is currently moving upward or downward, the script calculates specific boundary lines. Instead of smooth curves, these behave like steps; they hold their position until a price movement is significant enough to trigger a shift to the next level.
4. Stochastic Conversion The indicator takes these calculated "Step" values and converts them into a normalized scale (a 0 to 1 range). This allows you to see the relative strength of the current trend compared to the overall historical volatility of the asset.
Visual Signals
- Trend Lines: The script plots two main lines representing different sensitivity levels. These help you see where the price sits relative to the "Minimum" and "Mid" trend boundaries.
- Crossover Markers: The logic specifically looks for "crossover" moments—points where the relationship between the two calculated trends flips (e.g., when a faster trend line crosses over a slower one). When these specific shifts occur, the script places a visual marker (an "X") on the chart to alert you to a potential change in momentum or a shift in trend direction.
/*-----------------------------+
|			       |
| Shared by www.Aptrafx.com    |
|			       |
+------------------------------*/

//+------------------------------------------------------------------+
//|                                              StepMA_Stoch_v1.mq4 |
//|                           Copyright © 2005, TrendLaboratory Ltd. |
//|                                       E-mail: igorad2004@list.ru |
//+------------------------------------------------------------------+
#property copyright "Copyright © 2005, TrendLaboratory Ltd."
#property link      "E-mail: igorad2004@list.ru"

#property indicator_separate_window

#property indicator_buffers 3
#property indicator_color1 Yellow
#property indicator_color2 DeepSkyBlue
#property indicator_color3 White

#property indicator_minimum 0
#property indicator_maximum 1

//---- input parameters
extern int extPeriodWATR=10;
extern double extKwatr=1.0000;
extern int extHighLow=0;

//---- indicator buffers
double LineMinBuffer[];
double LineMidBuffer[];
double XBuffer[];


//+------------------------------------------------------------------+
//| Custom indicator initialization function                         |
//+------------------------------------------------------------------+
int init()
  {
   string short_name;

   //---- indicator lines
   SetIndexStyle(0, DRAW_LINE, STYLE_SOLID, 1);
   SetIndexBuffer(0, LineMinBuffer);
   SetIndexLabel(0, "StepMA Stoch 1");
   SetIndexDrawBegin(0, extPeriodWATR);

   SetIndexStyle(1, DRAW_LINE, STYLE_SOLID, 1);
   SetIndexBuffer(1, LineMidBuffer);
   SetIndexLabel(1, "StepMA Stoch 2");
   SetIndexDrawBegin(1, extPeriodWATR);

   // 233 up arrow
   // 234 down arrow
   // 159 big dot
   // 168 open square
   // 120 box with X
   SetIndexStyle(2, DRAW_ARROW, STYLE_SOLID,1);
   SetIndexBuffer(2, XBuffer);
   SetIndexArrow(2,120);
   SetIndexDrawBegin(1, extPeriodWATR);

   //---- name for DataWindow and indicator subwindow label
   short_name="StepMA Stoch("+extPeriodWATR+","+extKwatr+","+extHighLow+")";
   IndicatorShortName(short_name);
   IndicatorDigits(MarketInfo(Symbol(),MODE_DIGITS));

   return(0);
  }

//+------------------------------------------------------------------+
//| StepMA_3D_v1                                                         |
//+------------------------------------------------------------------+
int start()
  {
   int      i,shift,TrendMin,TrendMax,TrendMid;
   double   SminMin0,SmaxMin0,SminMin1,SmaxMin1,SumRange,dK,WATR0,WATRmax,WATRmin,WATRmid;
   double   SminMax0,SmaxMax0,SminMax1,SmaxMax1,SminMid0,SmaxMid0,SminMid1,SmaxMid1;
   double   linemin,linemax,linemid,bsmin,bsmax;
   double   Stoch1,Stoch2,pStoch1,pStoch2;
   bool     rising=false;
   bool     falling=false;

   for(shift=Bars-1;shift>=0;shift--)
     {
      SumRange=0;
      for (i=extPeriodWATR-1; i>=0; i--)
	     {
         dK = 1+1.0*(extPeriodWATR-i)/extPeriodWATR;
         SumRange+= dK*MathAbs(High[i+shift]-Low[i+shift]);
        }

      WATR0 = SumRange/extPeriodWATR;

      WATRmax=MathMax(WATR0,WATRmax);

      if (shift==Bars-1-extPeriodWATR) WATRmin=WATR0;

      WATRmin=MathMin(WATR0,WATRmin);

      int StepSizeMin=MathRound(extKwatr*WATRmin/Point);
      int StepSizeMax=MathRound(extKwatr*WATRmax/Point);
      int StepSizeMid=MathRound(extKwatr*0.5*(WATRmax+WATRmin)/Point);


      if (extHighLow!=0)
        {
         SmaxMin0=Low[shift]+2*StepSizeMin*Point;
         SminMin0=High[shift]-2*StepSizeMin*Point;

         SmaxMax0=Low[shift]+2*StepSizeMax*Point;
         SminMax0=High[shift]-2*StepSizeMax*Point;

         SmaxMid0=Low[shift]+2*StepSizeMid*Point;
         SminMid0=High[shift]-2*StepSizeMid*Point;

         if(Close[shift]>SmaxMin1) TrendMin=1;
         if(Close[shift]<SminMin1) TrendMin=-1;

         if(Close[shift]>SmaxMax1) TrendMax=1;
         if(Close[shift]<SminMax1) TrendMax=-1;

         if(Close[shift]>SmaxMid1) TrendMid=1;
         if(Close[shift]<SminMid1) TrendMid=-1;
        }
      else
        {
         SmaxMin0=Close[shift]+2*StepSizeMin*Point;
         SminMin0=Close[shift]-2*StepSizeMin*Point;

         SmaxMax0=Close[shift]+2*StepSizeMax*Point;
         SminMax0=Close[shift]-2*StepSizeMax*Point;

         SmaxMid0=Close[shift]+2*StepSizeMid*Point;
         SminMid0=Close[shift]-2*StepSizeMid*Point;

         if(Close[shift]>SmaxMin1) TrendMin=1;
         if(Close[shift]<SminMin1) TrendMin=-1;

         if(Close[shift]>SmaxMax1) TrendMax=1;
         if(Close[shift]<SminMax1) TrendMax=-1;

         if(Close[shift]>SmaxMid1) TrendMid=1;
         if(Close[shift]<SminMid1) TrendMid=-1;
        }


      if (TrendMin>0 && SminMin0<SminMin1) SminMin0=SminMin1;
      if (TrendMin<0 && SmaxMin0>SmaxMin1) SmaxMin0=SmaxMin1;

      if (TrendMax>0 && SminMax0<SminMax1) SminMax0=SminMax1;
      if (TrendMax<0 && SmaxMax0>SmaxMax1) SmaxMax0=SmaxMax1;

      if (TrendMid>0 && SminMid0<SminMid1) SminMid0=SminMid1;
      if (TrendMid<0 && SmaxMid0>SmaxMid1) SmaxMid0=SmaxMid1;

      if (TrendMin>0) linemin=SminMin0+StepSizeMin*Point;
      if (TrendMin<0) linemin=SmaxMin0-StepSizeMin*Point;

      if (TrendMax>0) linemax=SminMax0+StepSizeMax*Point;
      if (TrendMax<0) linemax=SmaxMax0-StepSizeMax*Point;

      if (TrendMid>0) linemid=SminMid0+StepSizeMid*Point;
      if (TrendMid<0) linemid=SmaxMid0-StepSizeMid*Point;

      bsmin=linemax-StepSizeMax*Point;
      bsmax=linemax+StepSizeMax*Point;

      pStoch1=Stoch1;
      Stoch1=(linemin-bsmin)/(bsmax-bsmin);
      pStoch2=Stoch2;
      Stoch2=(linemid-bsmin)/(bsmax-bsmin);

      rising=false;
      if (pStoch1<pStoch2 && Stoch1>=Stoch2) {rising=true;}
      falling=false;
      if (pStoch1>pStoch2 && Stoch1<=Stoch2) {falling=true;}

      LineMinBuffer[shift]=Stoch1;
      LineMidBuffer[shift]=Stoch2;

      if (rising)  {XBuffer[shift]=Stoch1;}
      if (falling) {XBuffer[shift]=Stoch1;}

      SminMin1=SminMin0;
      SmaxMin1=SmaxMin0;

      SminMax1=SminMax0;
      SmaxMax1=SmaxMax0;

      SminMid1=SminMid0;
      SmaxMid1=SmaxMid0;
     }
   return(0);
  }
Comments