CCIarrow
Download script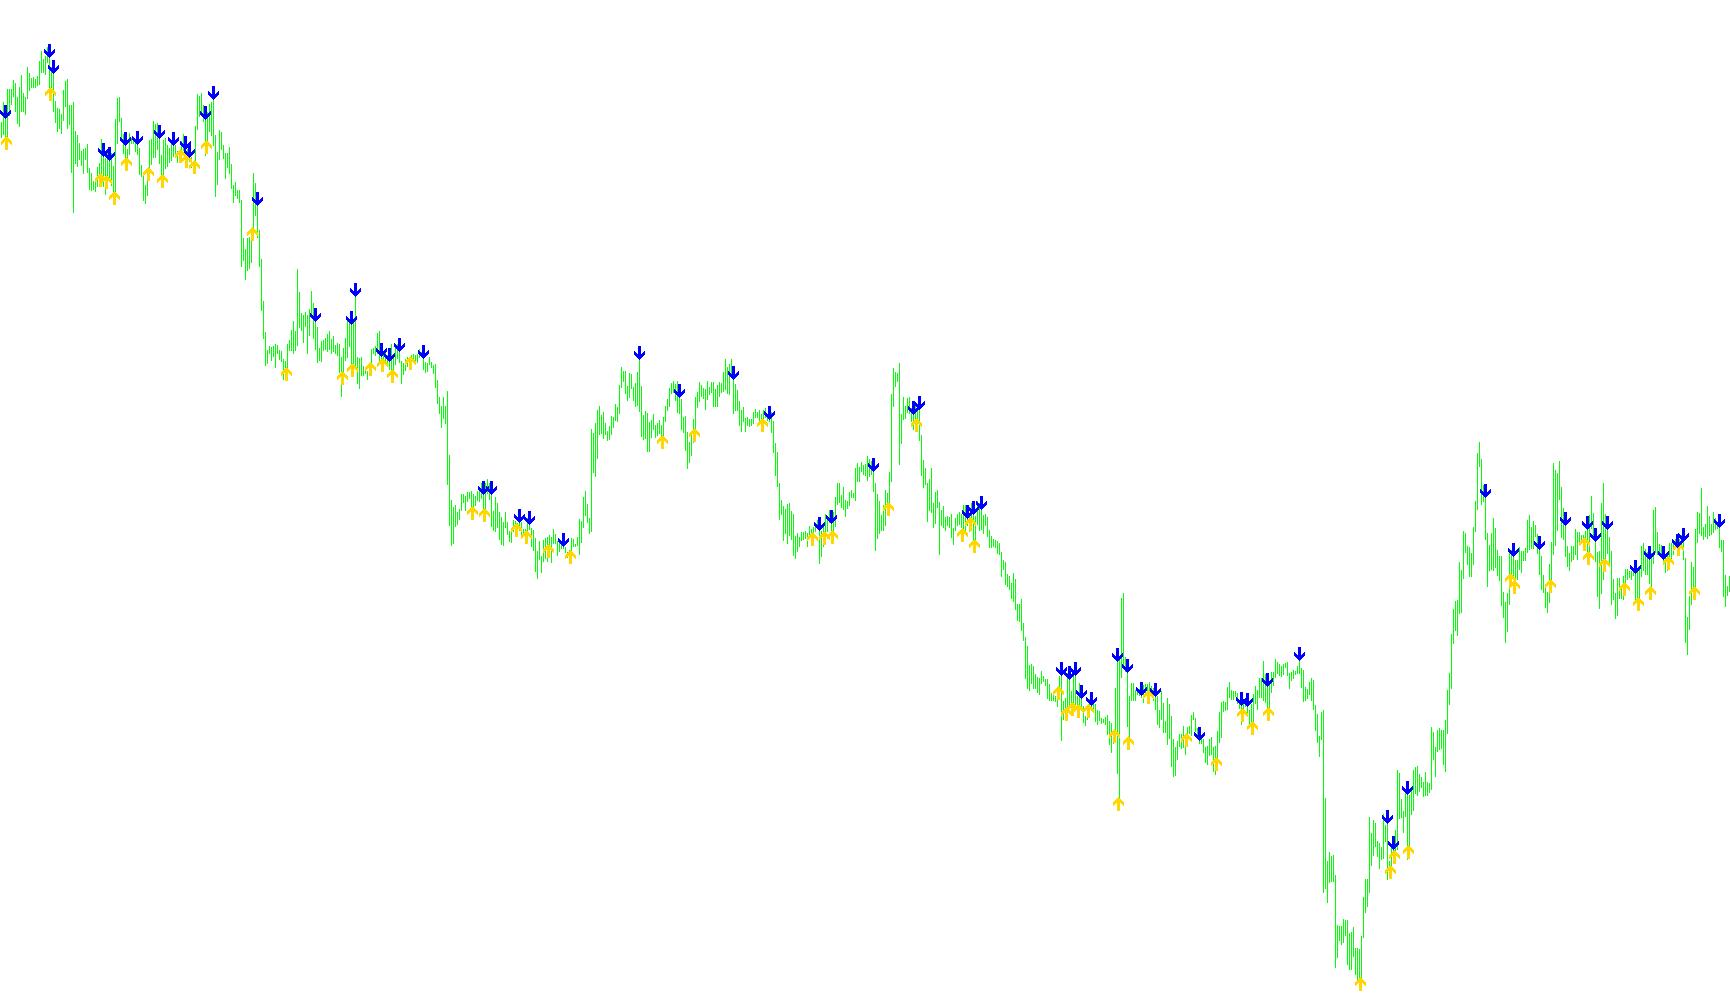
This trading tool is designed to identify specific momentum shifts in the market by analyzing price fluctuations over a set period. It acts as a visual guide on your chart, highlighting potential entry points for "Buy" and "Sell" positions based on the behavior of a technical oscillator known as the Commodity Channel Index (CCI).
How the Logic Works
The script constantly monitors the movement of the market price to determine the strength and direction of current trends. Instead of just looking at the current price, it compares where the price is now relative to where it was in the previous bar.
1. Identifying Buy Signals The tool looks for a specific "crossover" event. It monitors when the indicator moves from a negative value into a positive territory. When this transition occurs, it suggests that upward momentum is gaining strength. The script then places a visual marker (a blue arrow) just below the price candle to signal a potential buying opportunity.
2. Identifying Sell Signals Conversely, the tool monitors for when the indicator drops from a positive value into negative territory. This shift indicates that downward pressure is becoming dominant. When this happens, the script places a visual marker (a red arrow) just above the price candle to highlight a potential selling opportunity.
Key Features for the User
- Visual Clarity: Rather than forcing you to watch complex numerical data, the script translates these movements into clear visual icons directly on your trading candles.
- Customizable Sensitivity: The tool uses a "Period" setting (defaulting to 14). This allows you to adjust how much historical data the logic considers; a shorter period makes the tool more reactive to sudden changes, while a longer period focuses on smoother, broader trends.
- Precision Placement: The markers are programmed to appear slightly above or below the price candles (based on market points), ensuring they remain visible and do not clutter the actual price action of the bars.
In summary, this script automates the detection of momentum "flips," providing traders with clear visual cues for when the market sentiment might be shifting from bearish to bullish, or vice versa.
//+------------------------------------------------------------------+

//+------------------------------------------------------------------+
#property copyright ""

#property indicator_chart_window
#property indicator_buffers 3
#property indicator_color1 Blue
#property indicator_color2 Red
#property indicator_color3 Green

double dUpCCIBuffer[];
double dDownCCIBuffer[];
double dSellBuffer[];

extern int CCI_Period = 14;  //This value sets the CCI Period Used, The default is 21

int RowNum = 0;
int LastTrend = -1;
int UP_IND    = 1;
int DOWN_IND  = 0;

//+------------------------------------------------------------------+
//| Custom indicator initialization function                         |
//+------------------------------------------------------------------+
int init()
  {
//---- indicator buffers mapping
    SetIndexBuffer(0,dUpCCIBuffer);
    SetIndexBuffer(1,dDownCCIBuffer);
    SetIndexBuffer(2,dSellBuffer);
//---- drawing settings
    SetIndexStyle(0,DRAW_ARROW);
    SetIndexArrow(0,233); //241 option for different arrow head
    SetIndexStyle(1,DRAW_ARROW);
    SetIndexArrow(1,234); //242 option for different arrow head
    SetIndexStyle(2,DRAW_ARROW);
    SetIndexArrow(2,252);  //251 x sign or 252 green check

//----
    SetIndexEmptyValue(0,0.0);
    SetIndexEmptyValue(1,0.0);
    SetIndexEmptyValue(2,0.0);
//---- name for DataWindow
    SetIndexLabel(0,"CCI Buy");
    SetIndexLabel(1,"CCI Sell");
    SetIndexLabel(2,"Exit");
//----


   return(0);
  }
//+------------------------------------------------------------------+
//| Custor indicator deinitialization function                       |
//+------------------------------------------------------------------+
int deinit()
  {
//----
      ObjectsDeleteAll();
//----
   return(0);
  }


//+------------------------------------------------------------------+
//| Custom indicator iteration function                              |
//+------------------------------------------------------------------+
int start()
  {
   int nBars,nCountedBars;

    nCountedBars=IndicatorCounted(); //ncountedbars 655
//---- check for possible errors
    if(nCountedBars<0) return(-1);
//---- last counted bar will be recounted
    if(nCountedBars<=3)
       nBars=Bars-nCountedBars-4;

    if(nCountedBars>2)
      {
       nCountedBars--;
       nBars=Bars-nCountedBars-1; //number of bars in current chart-655-1
      }

int lastCloseLong=0;
int lastCloseShort=0;

   for (int ii=Bars; ii>0; ii--)
   {

      dUpCCIBuffer[ii]=0;
      dDownCCIBuffer[ii]=0;

      double myCCInow = iCCI(NULL,0,CCI_Period,PRICE_CLOSE,ii);
      double myCCI2 = iCCI(NULL,0,CCI_Period,PRICE_CLOSE,ii+1); //CCI One bar ago


      if (myCCInow>=0) //is going long
      {
         if(myCCInow>0 && myCCI2<0) //did it cross from below 50
         {

            dUpCCIBuffer[ii] = Low[ii] - 2 * MarketInfo(Symbol(),MODE_POINT);

         }

      }

      if(myCCInow<0)  //is going short
      {
         if(myCCInow<0 && myCCI2>0) //did it cross from above 50
         {

            dDownCCIBuffer[ii] = High[ii] + 2 * MarketInfo(Symbol(),MODE_POINT);

         }


      }


   }
}
Comments