carmens_eyes_v1.03
Download script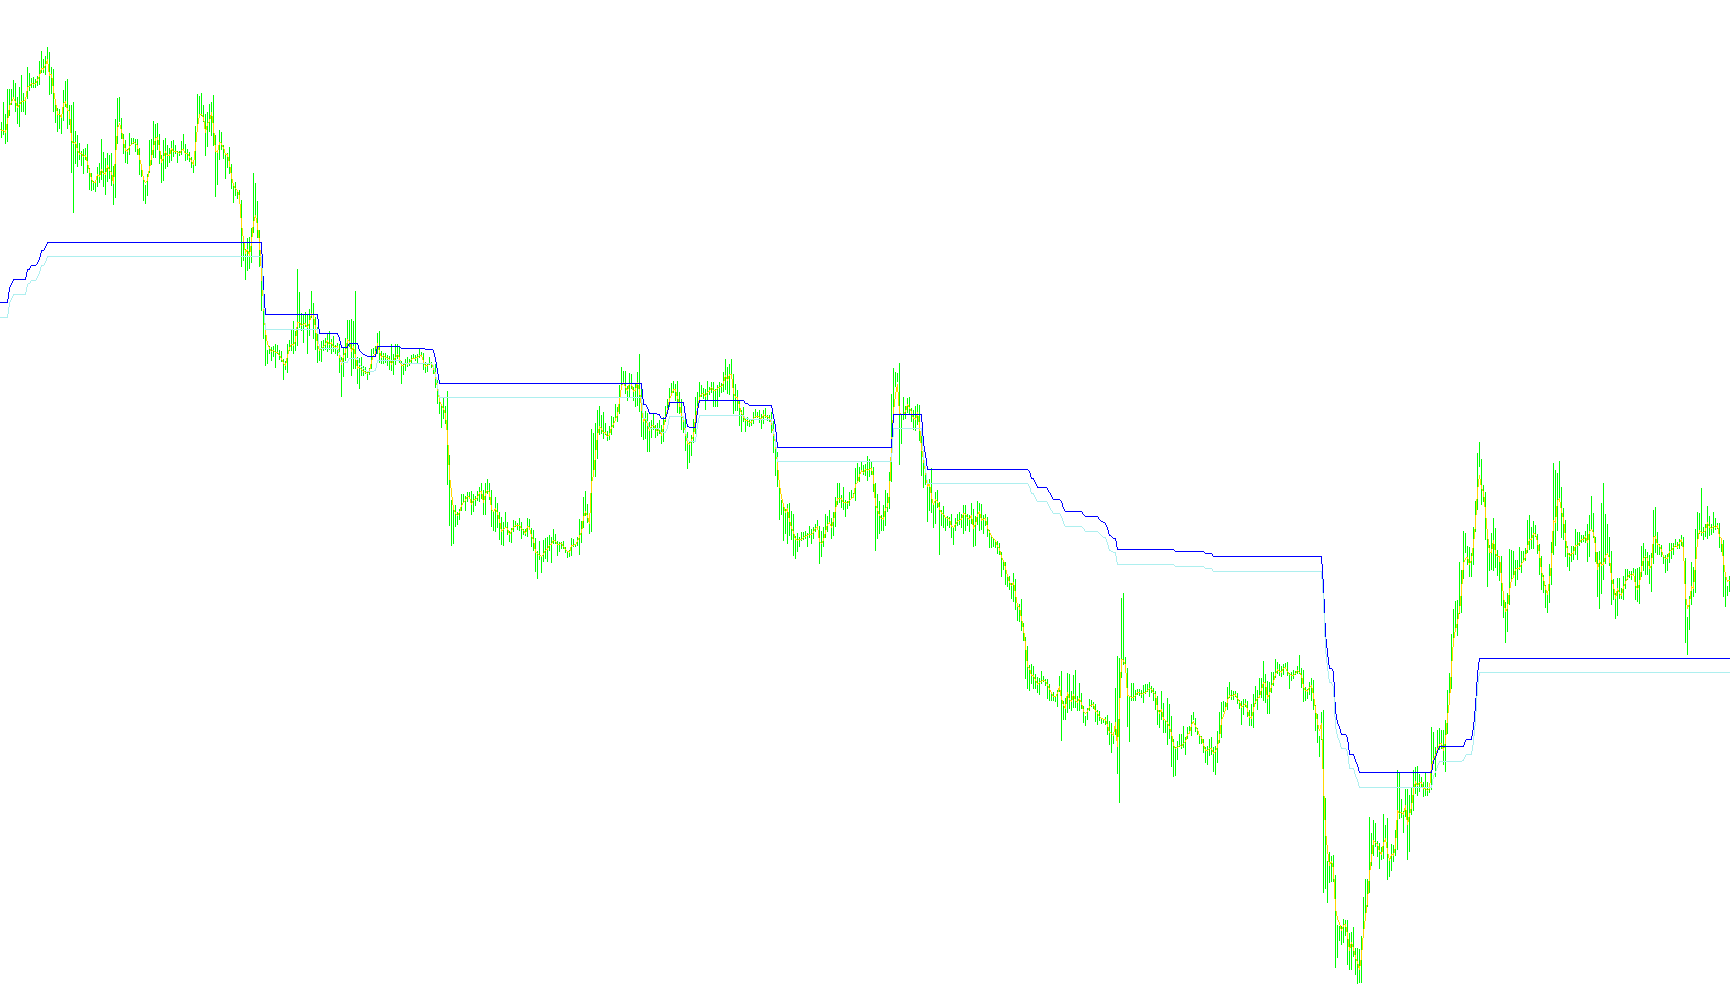
This tool is designed to provide a visual and analytical layer over price action, helping traders identify market trends and potential entry zones by monitoring the relationship between current prices and moving averages.
Core Logic Overview
The script operates by calculating a dynamic "moving average" of the currency pair's closing prices. Rather than just showing a standard line, it uses this data to project two specific boundaries—a Top and a Bottom level. The goal is to detect when the market price breaks out of a controlled range to signal a change in momentum.
Key Functional Components
-
Dynamic Tracking Zones: The script constantly calculates a baseline based on recent price history. It then projects an "expansion zone" around this baseline. Depending on the current market activity, the distance between the Top and Bottom levels can adjust automatically. This helps distinguish between stable, ranging markets and high-momentum trends.
-
Trend Detection (Buy and Sell Signals): The logic is programmed to react to two specific behaviors:
- Bullish Movement: If the price exceeds the projected "Top" boundary, the system identifies a potential upward trend (Order 1).
- Bearish Movement: If the price drops below the projected "Bottom" boundary, the system identifies a potential downward trend (Order 2).
-
Breakeven and Expansion Logic: A sophisticated part of this script is how it handles price "expansion." Once a trend is identified, the tool evaluates how far the price has moved. It uses specific thresholds to determine if the market is still in a steady growth phase or if it is expanding rapidly. It adjusts its tracking boundaries in real-time to ensure that the signals remain relevant even as volatility increases.
-
Visual Feedback: The script renders three distinct visual elements on the chart:
- A primary line representing the Average FX (the core moving average).
- A Top boundary representing the upper limit of current market stability.
- A Bottom boundary representing the lower limit of current market stability.
Summary for the User
In simple terms, this tool acts as a "guardrail" system. It draws boundaries around the current price action; when the price pushes outside of these guards, it signals that a new trend is forming. By watching where the Top and Bottom lines move and how they expand, traders can better visualize whether the market is currently moving with strength or simply drifting within a range.
//        +-------------------------------------------------------------------------------------------------------+
//        |                                                                                      carmens_eyes.mq4 |
//        |                                                                                     October 29th 2009 |
//                                                                                              aicccia@gmail.com |
//        +-------------------------------------------------------------------------------------------------------+

#property indicator_chart_window
#property indicator_buffers 3
#property indicator_color1 White
#property indicator_color2 Blue
#property indicator_color3 Yellow

       int    average=3;
extern double breakeven_buffer=6;
extern double space=1;
extern double expand_rate=75;
extern double till_breakeven_rate=1;

double AverageFX[];
double Top[];
double Bottom[];

int max,order;
double bed,tal,atr,step,deviation,bu,sl,maxlow,maxhigh,isranging,istime,dif;
bool ranging;

int init()
  {
   max=50;

   SetIndexStyle(0,DRAW_LINE);
   SetIndexBuffer(0,AverageFX);
   SetIndexStyle(1,DRAW_LINE);
   SetIndexBuffer(1,Top);
   SetIndexStyle(2,DRAW_LINE);
   SetIndexBuffer(2,Bottom);

   SetIndexDrawBegin(0,max);
   SetIndexDrawBegin(1,max);
   SetIndexDrawBegin(2,max);

   if(Digits==5 || Digits==3)  { dif=Point*10; } else dif=Point;

   return(0);
  }

int start()
  {
   int    i,k,x,counted_bars=IndicatorCounted();
   double buffer,sum,newres,BandsDeviation,distance,sub,expandingx=till_breakeven_rate,mh;
   bool condition1=false;

   if(Bars<=max) { return(0); }
   if(counted_bars<1)
      for(i=1;i<=max;i++)
        {
         AverageFX[Bars-i]=EMPTY_VALUE;
         Top[Bars-i]=EMPTY_VALUE;
         Bottom[Bars-i]=EMPTY_VALUE;
         }

   int limit=Bars-counted_bars;
   if(counted_bars>0) limit++;
   for(i=0; i<limit; i++)
      AverageFX[i]=iMA(NULL,0,average,0,MODE_EMA,PRICE_CLOSE,i);

   i=Bars-max+1;
   if(counted_bars>max-1) i=Bars-counted_bars-1;
   while(i>=0)
     {
      buffer=6*space*dif;

      if((order==1) && (step<(bu+(breakeven_buffer*dif))))   { expandingx=(till_breakeven_rate*dif); }
      if((order==1) && (step>(bu+(breakeven_buffer*dif))))   { expandingx=(expand_rate*dif);  }
      if((order==2) && (step>(sl-(breakeven_buffer*dif))))   { expandingx=(till_breakeven_rate*dif); }
      if((order==2) && (step<(sl-(breakeven_buffer*dif))))   { expandingx=(expand_rate*dif);  }

      if(order==0) { step=AverageFX[i]-(till_breakeven_rate*dif); }
      if(order==1) { // Buy
         if((AverageFX[i]>step) && MathAbs(AverageFX[i]-step)>expandingx)                    { step=AverageFX[i]-expandingx;         }}
      if(order==2) { // Sell
         if((AverageFX[i]<(step-buffer)) && MathAbs(AverageFX[i]-(step-buffer))>expandingx)  { step=AverageFX[i]+expandingx+buffer;  }}

      Top[i]=step;
      Bottom[i]=step-buffer;

      if(AverageFX[i]>Top[i])    { order=1; if(bu==0) { bu=AverageFX[i]; sl=0; }}
      if(AverageFX[i]<Bottom[i]) { order=2; if(sl==0) { sl=AverageFX[i]; bu=0; }}

      i--; }

   return(0);
  }
Comments