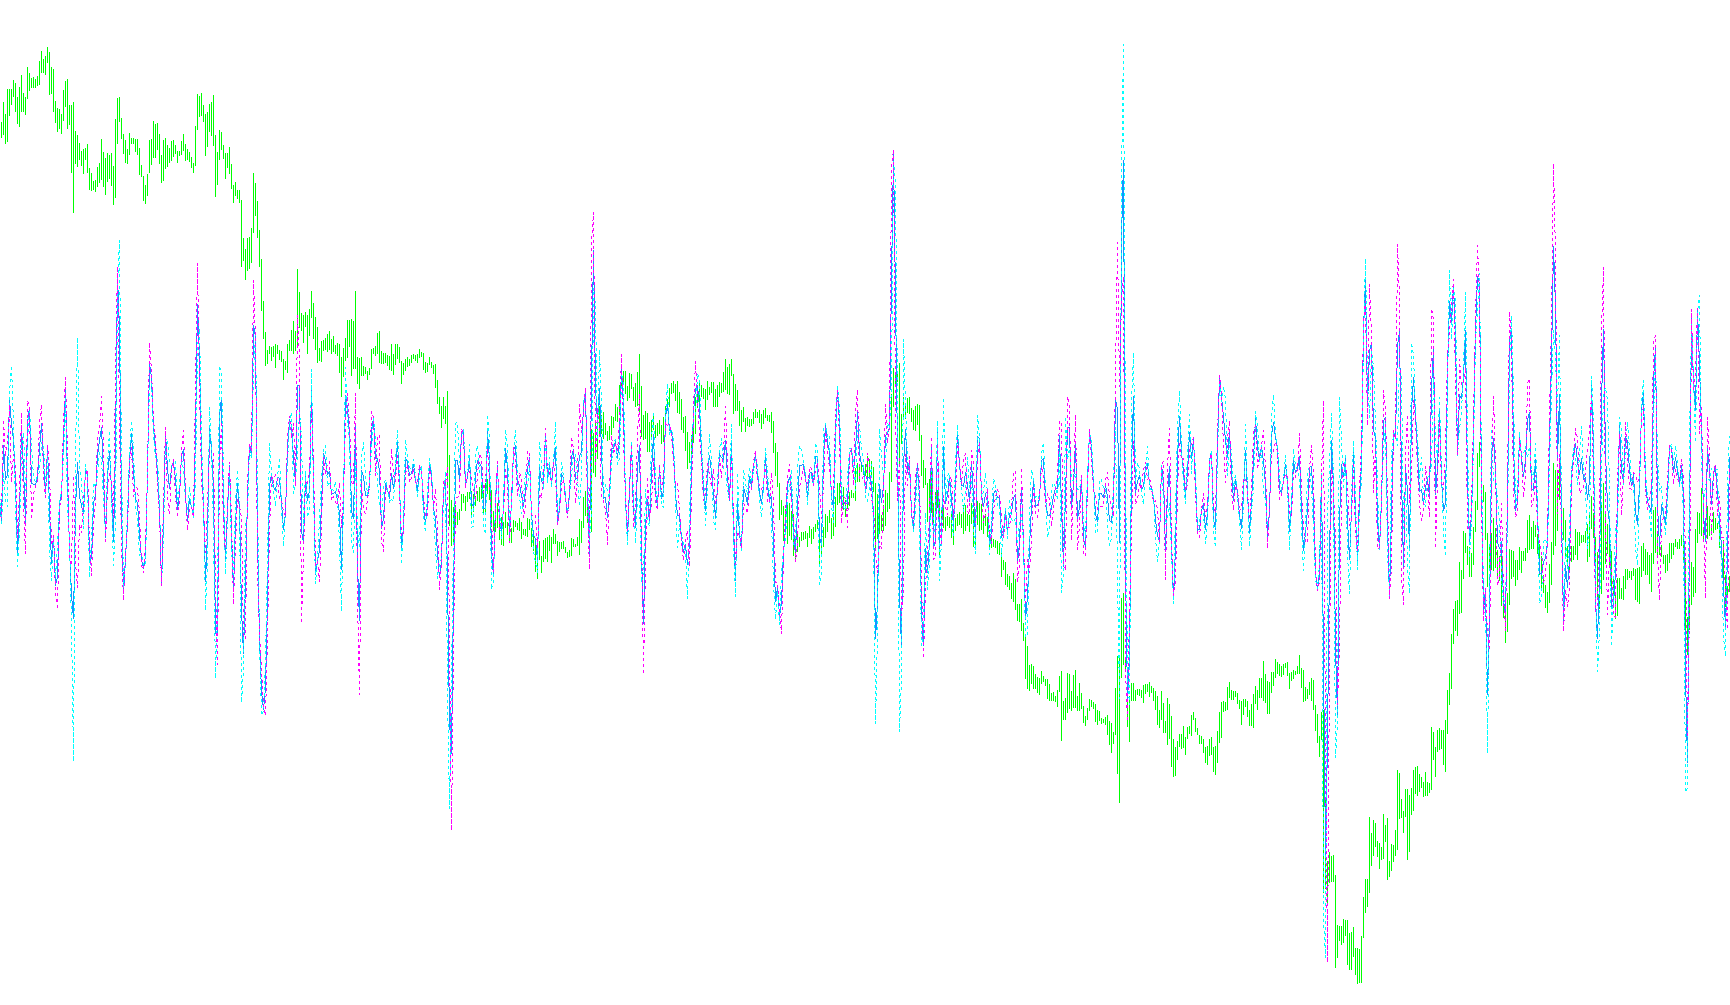
The AV indicator is designed as a momentum and volatility tracking tool for MetaTrader platforms. Its primary purpose is to analyze price action by measuring the velocity of change between different points on a chart, providing traders with a clearer picture of market trends compared to standard price movements alone.
Core Operational Logic
The script functions by looking at specific intervals—defined by a user-adjustable "Wide" parameter—to calculate three distinct types of movement:
- Midpoint Velocity: It calculates the center point (the midpoint between the high and low) of current price candles and compares them to previous points. This helps in identifying how the "heart" of the price action is moving, filtering out minor noise from extreme highs or lows.
- Low-Point Movement: The tool tracks the progression of the candle bottoms. By measuring the distance covered by the low prices over a specific period, it provides insight into the underlying support shifts and the "floor" of the market trend.
- High-Point Movement: Similarly, it monitors the progression of the candle tops. This measures the expansion of price peaks, helping to visualize the "ceiling" of market movement and overall bullish or bearish strength.
Visualization and Customization
The indicator offers a toggleable viewing experience through an accuracy setting:
- Volatility Focus (Default): When the primary setting is active, the tool highlights the raw velocity of these three movements (Midpoint, Lows, and Highs). This allows traders to see the immediate speed and direction of price changes across different price levels.
- Acceleration Focus: When switched to the alternative mode, the script shifts its logic to display the rate of change of those velocities. Essentially, instead of showing how fast the price is moving, it shows whether that speed is increasing or decreasing, which can help in identifying potential trend exhaustion or new breakouts.
Technical Execution
To ensure accuracy, the script processes historical data by looping backward through the chart's history. It performs these calculations for every bar, ensuring that the current live price (the "Bid") is factored into the most recent calculation. By normalizing these values against the "Wide" parameter, the indicator scales the movement into a readable percentage-based format, making it easier for traders to interpret market momentum at a glance.
//+------------------------------------------------------------------+
//|                                                           AV.mq4 |
//|                                        Copyright © 2006, Mistral |
//|                                                                  |
//+------------------------------------------------------------------+
#property copyright "Mistral, 2006"
#property link      ""

#property indicator_separate_window
#property indicator_buffers 6
#property indicator_color1 LavenderBlush
#property indicator_color2 OrangeRed
#property indicator_color3 SpringGreen
#property indicator_color4 LavenderBlush
#property indicator_color5 OrangeRed
#property indicator_color6 SpringGreen
//---- input parameters
extern int Acc=0;
extern int Wide=2;
//---- buffers
double AIB1[];
double AIB2[];
double AIB3[];
double VIB1[];
double VIB2[];
double VIB3[];
//+------------------------------------------------------------------+
//| AVc indicator initialization function                            |
//+------------------------------------------------------------------+
int init()
  {
//---- indicators
   string short_name;
   if (Acc==0)
   {
      SetIndexStyle(0,DRAW_NONE);
      SetIndexStyle(1,DRAW_NONE);
      SetIndexStyle(2,DRAW_NONE);
      SetIndexStyle(3,DRAW_LINE);
      SetIndexStyle(4,DRAW_LINE,STYLE_DOT);
      SetIndexStyle(5,DRAW_LINE,STYLE_DOT);
      short_name="VI("+Wide+")";
   }
   if (Acc==1)
   {
      SetIndexStyle(0,DRAW_LINE);
      SetIndexStyle(1,DRAW_LINE,STYLE_DOT);
      SetIndexStyle(2,DRAW_LINE,STYLE_DOT);
      SetIndexStyle(3,DRAW_NONE);
      SetIndexStyle(4,DRAW_NONE);
      SetIndexStyle(5,DRAW_NONE);
      short_name="AI("+Wide+")";
   }
   SetIndexBuffer(0,AIB1);
   SetIndexBuffer(1,AIB2);
   SetIndexBuffer(2,AIB3);
   SetIndexBuffer(3,VIB1);
   SetIndexBuffer(4,VIB2);
   SetIndexBuffer(5,VIB3);
   IndicatorShortName(short_name);
   SetIndexLabel(0,short_name+"M");
   SetIndexLabel(1,short_name+"L");
   SetIndexLabel(2,short_name+"H");
   SetIndexLabel(3,short_name+"M");
   SetIndexLabel(4,short_name+"L");
   SetIndexLabel(5,short_name+"H");
//----
   return(0);
  }
//+------------------------------------------------------------------+
//| AV indicator deinitialization function                           |
//+------------------------------------------------------------------+
int deinit()
  {
//----

//----
   return(0);
  }
//+------------------------------------------------------------------+
//| AV indicator iteration function                                  |
//+------------------------------------------------------------------+
int start()
  {
   int      i,j,counted_bars=IndicatorCounted();
   double   mp1,mp2;
//----
   if(Bars<=(Wide*2)) return(0);
//---- initial zero
   if(counted_bars<1)
      for(i=1;i<=(Wide*2);i++) AIB1[Bars-i]=0.0;AIB2[Bars-i]=0.0;AIB3[Bars-i]=0.0;VIB1[Bars-i]=0.0;VIB2[Bars-i]=0.0;VIB3[Bars-i]=0.0;
//----
   i=Bars-Wide-1;
   if(counted_bars>=Wide) i=Bars-counted_bars-1;
   j=i-Wide;
   while(i>=0)
     {
      mp1=High[i]-(High[i]-Low[i])/2;
      mp2=High[i+Wide]-(High[i+Wide]-Low[i+Wide])/2;
      VIB1[i]=(mp1-mp2)*100/Wide;
      VIB2[i]=(Low[i]-Low[i+Wide])*100/Wide;
      VIB3[i]=(High[i]-High[i+Wide])*100/Wide;
      if (i==0) VIB1[i]=(Bid-mp2)*100/Wide;
      if (i<=j) AIB1[i]=(VIB1[i]-VIB1[i+Wide])/Wide;AIB2[i]=(VIB2[i]-VIB2[i+Wide])/Wide;AIB3[i]=(VIB3[i]-VIB3[i+Wide])/Wide;
      i--;
     }
   return(0);
  }
//+------------------------------------------------------------------+
Comments