MTF_MA_001
Download script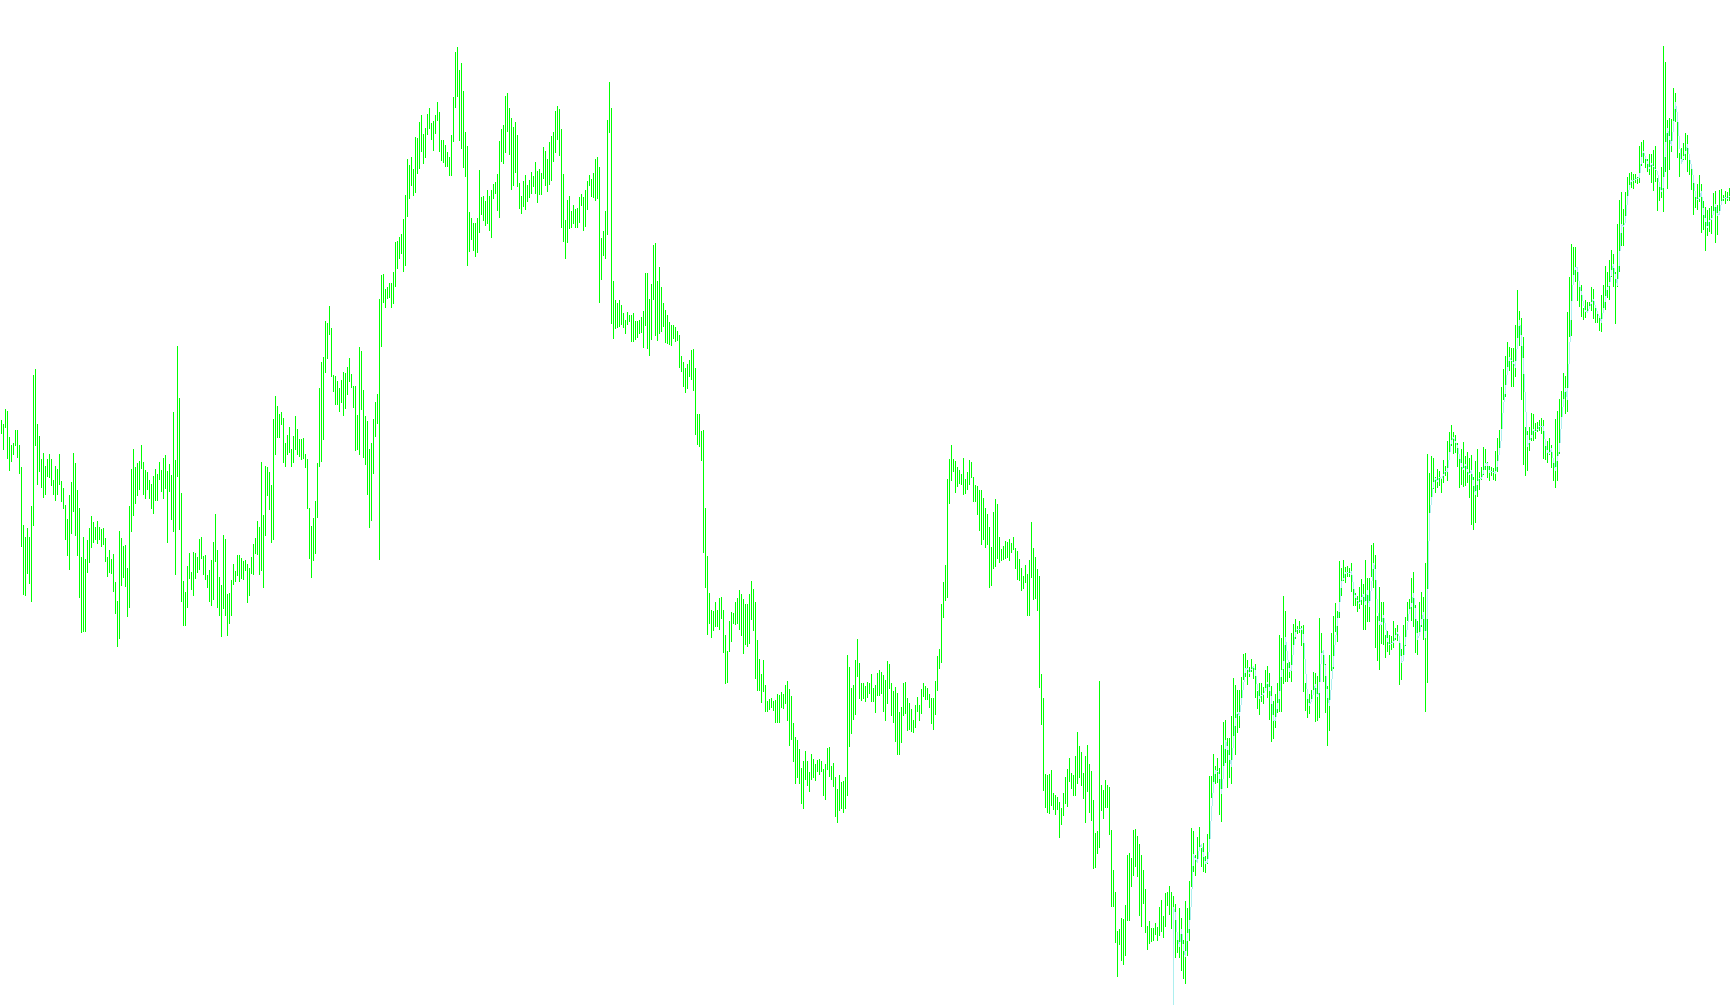
This script is designed as a visual trend analysis tool that helps traders identify the direction of market movements by processing price data through multiple layers of calculation. Rather than just showing a simple moving average, it analyzes the relationship between different timeframes and smoothing techniques to provide a clearer picture of the current trend.
Core Logic Overview
The script functions by taking raw price data and passing it through a three-step transformation process:
1. Multi-Timeframe Data Gathering The tool begins by looking at specific price points (like closing prices) across a user-defined timeframe. It calculates an initial "Raw" moving average based on a set period. This allows the indicator to provide context from broader market movements even if you are viewing a smaller chart.
2. Advanced Smoothing To filter out "market noise"—those small, rapid price fluctuations that can trigger false signals—the script takes that Raw Data and applies a secondary smoothing calculation. This step creates a much cleaner line that represents the underlying momentum of the asset.
3. Trend Detection and Visualization Once the smoothed data is generated, the script performs a comparative analysis between the current value and the previous value:
- Uptrend Identification: If the current smoothed value is higher than the previous one, the logic identifies an upward trend.
- Downtrend Identification: If the current value is lower than the previous one, it identifies a downward trend.
Visual Representation Options
The script offers two distinct ways to display this information on your chart:
- Two-Color Trend: This is the primary visual mode. The indicator uses two different colors (typically Aqua and Red) to represent bullish and bearish movements. When the trend shifts, the colors switch dynamically, allowing you to see exactly where a move turned from positive to negative.
- Raw Data Overlay: Users have the option to display the "Raw" data alongside the smoothed lines. This is helpful for traders who want to see the original market movement in comparison to the filtered trend line.
Summary of User Experience
In simple terms, this script acts as a sophisticated filter. It looks at the market's history, smooths out the erratic jumps, and draws a clean, color-coded path on your chart. This helps you stay aligned with the primary direction of the market while ignoring minor price distractions.
#property indicator_chart_window
//#property indicator_separate_window
#property indicator_buffers 3
#property indicator_color1 Aqua
#property indicator_color2 Red
#property indicator_color3 White
//**************************************************************************/
extern int TimeFrame=15;
extern int MAPeriod=8;
extern int ma_method=MODE_LWMA;
extern bool ShowRawData = true;
extern bool ColorTrend = true;
extern int applied_price=PRICE_CLOSE;

double ExtMapBuffer1[];
double ExtMapBuffer2[];
double ExtMapBuffer3[];

double RawBuffer[];
double SmoothBuffer[];
double trend[],Dir;
int i, limit;

//+------------------------------------------------------------------+
//| Custom indicator initialization function                         |
//+------------------------------------------------------------------+
int init()
  {
   SetIndexBuffer(0,ExtMapBuffer1);
   SetIndexStyle(0,DRAW_LINE,STYLE_SOLID);
   SetIndexBuffer(1,ExtMapBuffer2);
   SetIndexStyle(1,DRAW_LINE,STYLE_SOLID);
   SetIndexBuffer(2,ExtMapBuffer3);
   SetIndexStyle(2,DRAW_LINE,STYLE_SOLID);
   return(0);
   }
//+------------------------------------------------------------------+
//| MTF Moving Average                                               |
//+------------------------------------------------------------------+
int start()
   {

    //GlobalVariableSet("NLMA", 0);
   //InitAllBuffers();
   Draw();
   //GlobalVariableSet("NLMA", trend[0]);
   //if(Dir == 1) GlobalVariableSet("NLMA", 1);//DrawVline(Yellow, Time[0]);

        i= 500;
      while(i >= 0)
         {
            //Print("Trend: ",trend[i]);
            //if( ExtMapBuffer1[i] >  ExtMapBuffer1[i+1]) DrawVline(Yellow, Time[i]);

          i--;
         }


   return(0);
   }
//+------------------------------------------------------------------+

//--------------- Draw -----------------------------------------------
void Draw()
{
      limit=Bars;

//WWWWWWWWWWWWWWWWWWW
      ArrayResize(RawBuffer, limit + 100);
      ArrayResize(SmoothBuffer, limit + 100);
      ArrayResize(trend, limit + 100);
      ArrayResize(ExtMapBuffer1, limit + 100);
      ArrayResize(ExtMapBuffer2, limit + 100);
      ArrayResize(ExtMapBuffer3, limit + 100);
      //
      ArrayInitialize(ExtMapBuffer1,0);
      ArrayInitialize(ExtMapBuffer2,0);
      ArrayInitialize(ExtMapBuffer3,0);
      ArrayInitialize(RawBuffer,0);
      ArrayInitialize(SmoothBuffer,0);
      ArrayInitialize(trend,0);
      //
      ArraySetAsSeries(RawBuffer,true);
      //
      ArraySetAsSeries(SmoothBuffer,true);
      ArraySetAsSeries(trend,true);
      ArraySetAsSeries(ExtMapBuffer1,true);
      ArraySetAsSeries(ExtMapBuffer2,true);
      ArraySetAsSeries(ExtMapBuffer3,true);
//WWWWWWWWWWWWWWWWWWW
      i= limit;
      while(i >= 0)
         {
         int Bar_Shift=iBarShift(NULL,TimeFrame,Time[i],false);
         RawBuffer[i]=iMA(NULL,TimeFrame,MAPeriod,0,ma_method,applied_price,Bar_Shift);
         if(ShowRawData) ExtMapBuffer3[i]= RawBuffer[i];

         i--;
         }

      i= limit;
      while(i >= 0)
         {
          SmoothBuffer[i] = iMAOnArray(RawBuffer,0,(TimeFrame/Period() ),0,0,i);
         ExtMapBuffer1[i] = SmoothBuffer[i];//Uptrend


         trend[i] = trend[i+1];
         if (SmoothBuffer[i]> SmoothBuffer[i+1])
            {
            trend[i] =1;
            Dir = 1;
            }
         if (SmoothBuffer[i]< SmoothBuffer[i+1])
            {
            trend[i] =-1;
            Dir = -1;
            }
   //if(trend[i] == 1) GlobalVariableSet("NLMA", trend[0]);//DrawVline(Yellow, Time[i]);


          if( ColorTrend)//Two-color trend
            {


            if (trend[i]>0)
               {
               //DrawVline(Yellow, Time[i]);
               //GlobalVariableSet("NLMA", trend[i]);
               ExtMapBuffer1[i] = SmoothBuffer[i];//Uptrend
               if (trend[i+1]<0) ExtMapBuffer1[i+1]=SmoothBuffer[i+1];
               ExtMapBuffer2[i] = EMPTY_VALUE;
               }
            else
            if (trend[i]<0)
               {
               ExtMapBuffer2[i] = SmoothBuffer[i];//Downtrend
               if (trend[i+1]>0) ExtMapBuffer2[i+1]=SmoothBuffer[i+1];
               ExtMapBuffer1[i] = EMPTY_VALUE;
               }
            }else//Single-color trend
            ExtMapBuffer1[i]=trend[i];//SmoothBuffer[i];


         i--;
         }

//--------
   return(0);
   }
//-----------------------------------------------------------------------------


//-----------------------------------------------------------
void InitAllBuffers ()
   {
//
double ExtMapBuffer1[];
double ExtMapBuffer2[];
double ExtMapBuffer3[];

double RawBuffer[];
double SmoothBuffer[];
double trend[],Dir;
//
      limit=Bars;
      ArrayResize(RawBuffer, limit + 100);
      ArrayResize(SmoothBuffer, limit + 100);
      ArrayResize(trend, limit + 100);
      ArrayResize(ExtMapBuffer1, limit + 100);
      ArrayResize(ExtMapBuffer2, limit + 100);
      ArrayResize(ExtMapBuffer3, limit + 100);
      //
      ArrayInitialize(ExtMapBuffer1,0);
      ArrayInitialize(ExtMapBuffer2,0);
      ArrayInitialize(ExtMapBuffer3,0);
      ArrayInitialize(RawBuffer,0);
      ArrayInitialize(SmoothBuffer,0);
      ArrayInitialize(trend,0);
      //
      ArraySetAsSeries(RawBuffer,true);

   return(0);
   }
//-----------------------------------------------------------


//-----------------------------------------------------------
void DrawVline (color Color, datetime time)
   {
   static int ObjCnt;
   static double PrevVlineTime;
   if (time == PrevVlineTime) return(0);//Still on same bar
      ObjectCreate( "UpLine"+ObjCnt, OBJ_VLINE, 0, time, 0);
      ObjectSet("UpLine"+ObjCnt, OBJPROP_COLOR, Color);
      ObjectSet("UpLine"+ObjCnt, OBJPROP_BACK,true);
      ObjCnt++;
      PrevVlineTime = time;//Store bar time of last drawn line
   return(0);
   }
//-----------------------------------------------------------
Comments