(2) super-signals_v1
Download script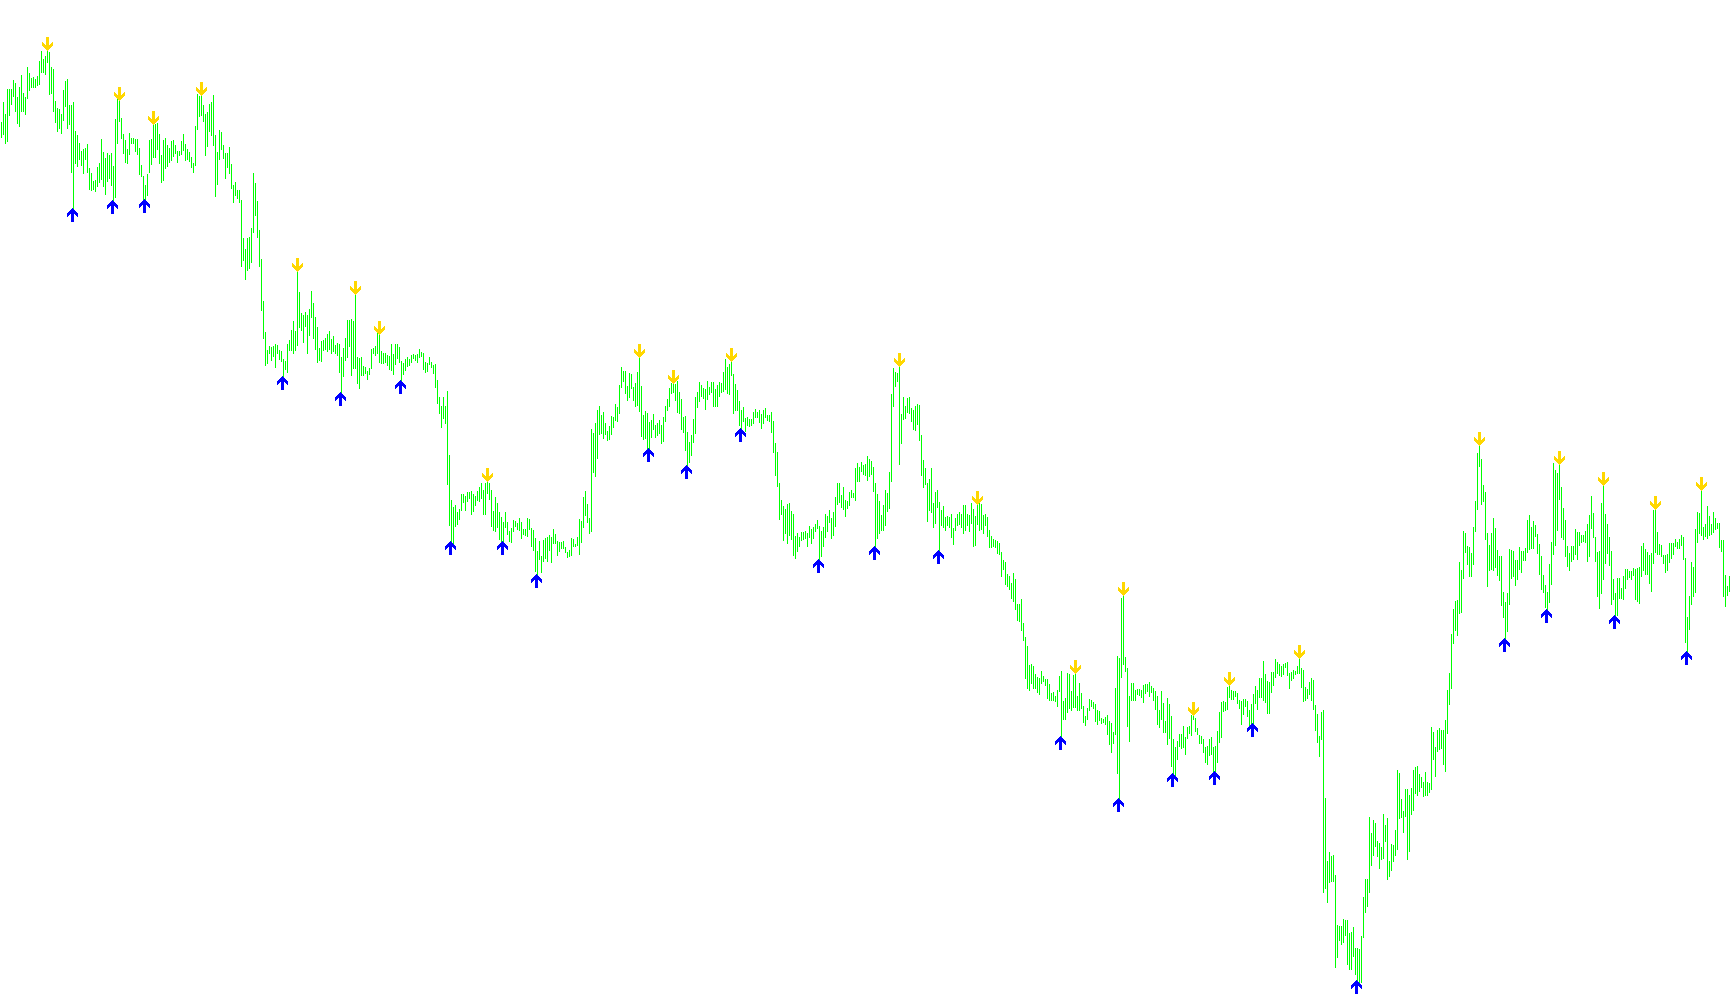
This tool is designed to help traders visually identify significant structural turning points in market price action. Rather than relying on complex mathematical formulas or lagging indicators, it focuses on identifying extreme "peaks" and "valleys" within specific windows of time on your trading chart.
How the Logic Works
The script constantly scans the historical price data to locate local highs and lows. It looks at a rolling window of recent candles (defined by a set distance) to determine where the price reached its highest and lowest points relative to its immediate surroundings.
Identifying Highs (Sell Signals): When the script detects that a specific candle represents the highest point within its designated window, it places a yellow visual marker above that candle. This serves as an alert that the price has reached a local "ceiling," potentially indicating a zone where selling pressure might increase.
Identifying Lows (Buy Signals): Conversely, when the script identifies a candle as the lowest point within its specific window, it places an aqua-colored visual marker below that candle. This highlights a local "floor," suggesting a price area where buying interest may be significant.
Key Features for the Trader
- Visual Clarity: The markers are placed at a slight offset (a "Signal Gap") away from the actual candles. This ensures the icons do not overlap with the price bars, keeping your chart clean and easy to read.
- Contextual Awareness: By looking at a specific "distance" of candles at once, the tool filters out minor price fluctuations and highlights only the most prominent structural peaks and valleys.
- Real-Time Mapping: The script automatically calculates these points as new data arrives, providing a consistent historical map of where the market has turned in the past, which can help in identifying support and resistance levels.
//+------------------------------------------------------------------+
//|                                                super-signals.mq4 |
//|                Copyright © 2006, Nick Bilak, beluck[AT]gmail.com |
//+------------------------------------------------------------------+
#property copyright "Copyright © 2006, Nick Bilak"
#property link      "http://www.forex-tsd.com/"

#property indicator_chart_window
#property indicator_buffers 2
#property indicator_color1 Yellow
#property indicator_color2 Aqua

extern int SignalGap = 10;

int dist=24;
double b1[];
double b2[];

int init()  {
   SetIndexStyle(0,DRAW_ARROW,STYLE_SOLID,1);
   SetIndexStyle(1,DRAW_ARROW,STYLE_SOLID,1);
   SetIndexArrow(1,233);
   SetIndexArrow(0,234);
   SetIndexBuffer(0,b1);
   SetIndexBuffer(1,b2);
   return(0);
}
int start() {
   int counted_bars=IndicatorCounted();
   int k,i,j,limit,hhb,llb;

   if (counted_bars<0) return(-1);
   if (counted_bars>0) counted_bars--;
   limit=Bars-1;
   if(counted_bars>=1) limit=Bars-counted_bars-1;
   if (limit<0) limit=0;

   for (i=limit;i>=0;i--)   {
      hhb = Highest(NULL,0,MODE_HIGH,dist,i-dist/2);
      llb = Lowest(NULL,0,MODE_LOW,dist,i-dist/2);

      if (i==hhb)
         b1[i]=High[hhb]+SignalGap*Point;
      if (i==llb)
         b2[i]=Low[llb]-SignalGap*Point;
   }
   return(0);
}
Comments