#super-signals_v2
Download script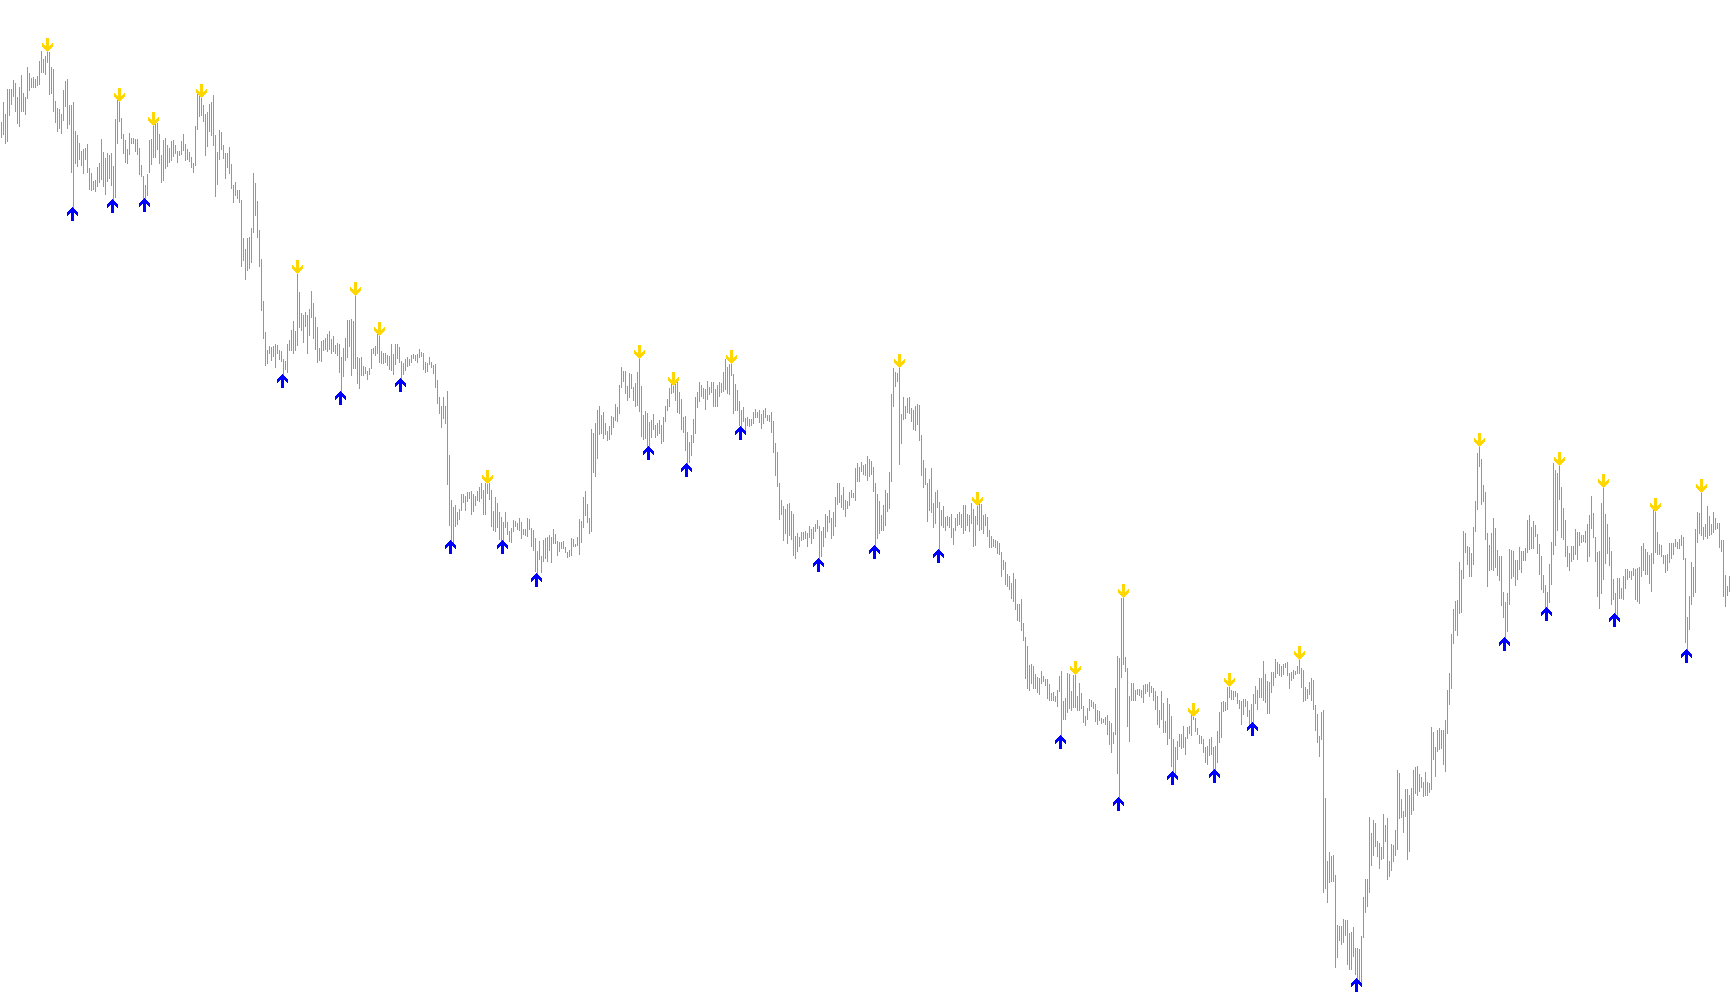
This script is designed as a visual trading tool that identifies significant "turning points" or local peaks and valleys in price action. Instead of providing complex mathematical projections, it focuses on highlighting the most prominent high and low points within a specific rolling window of time.
How the Logic Works
The core functionality of the script relies on identifying extremes. Here is the step-by-step logic:
- Rolling Window Analysis: The script looks at a fixed number of preceding bars (a "distance") to determine what constitutes a high or a low. By analyzing this specific window, the tool ensures it is reacting to recent market structure rather than outdated price data.
- Identifying Peaks and Valleys:
- It scans the historical data to find the highest price point reached within that rolling window. When the script identifies that the current bar matches that maximum price, it marks it as a peak.
- Simultaneously, it looks for the lowest price point reached within that same window. When the current bar matches that minimum price, it marks it as a valley.
- Visual Signaling: Once these extreme points are confirmed, the script places visual indicators (arrows) directly on the chart:
- A signal is placed slightly above the highest peak to highlight resistance or a top-out point.
- A signal is placed slightly below the lowest valley to highlight support or a bottom-out point.
- Spacing and Clarity: To ensure the signals do not overlap with the actual price candles, the script includes a small "Gap" setting. This ensures that the arrows are plotted at a clean distance from the price, making them easy for a human trader to see at a glance.
Summary of Purpose
The logic serves as a structural map of the market. By highlighting these local highs and lows, it helps traders visualize where the price has reached a temporary extreme, allowing for a clearer understanding of the market's "geography" and potential areas of reversal or consolidation.
Miscellaneous
10
Views
1
Downloads
0
Favorites
#super-signals_v2
//+------------------------------------------------------------------+
//|                                                super-signals.mq4 |
//|                Copyright © 2006, Nick Bilak, beluck[AT]gmail.com |
//+------------------------------------------------------------------+
#property copyright "Copyright © 2006, Nick Bilak"
#property link      "http://www.forex-tsd.com/"

#property indicator_chart_window
#property indicator_buffers 2
#property indicator_color1 Red
#property indicator_width1 2
#property indicator_color2 Lime
#property indicator_width2 2

extern int SignalGap = 4;

int dist=24;
double b1[];
double b2[];

int init()  {
   SetIndexStyle(0,DRAW_ARROW,STYLE_SOLID,1);
   SetIndexStyle(1,DRAW_ARROW,STYLE_SOLID,1);
   SetIndexArrow(1,233);
   SetIndexArrow(0,234);
   SetIndexBuffer(0,b1);
   SetIndexBuffer(1,b2);
   return(0);
}
int start() {
   int counted_bars=IndicatorCounted();
   int k,i,j,limit,hhb,llb;

   if (counted_bars<0) return(-1);
   if (counted_bars>0) counted_bars--;
   limit=Bars-1;
   if(counted_bars>=1) limit=Bars-counted_bars-1;
   if (limit<0) limit=0;

   for (i=limit;i>=0;i--)   {
      hhb = Highest(NULL,0,MODE_HIGH,dist,i-dist/2);
      llb = Lowest(NULL,0,MODE_LOW,dist,i-dist/2);

      if (i==hhb)
         b1[i]=High[hhb]+SignalGap*Point;
      if (i==llb)
         b2[i]=Low[llb]-SignalGap*Point;
   }
   return(0);
}
Comments