T&C Wonders
Download script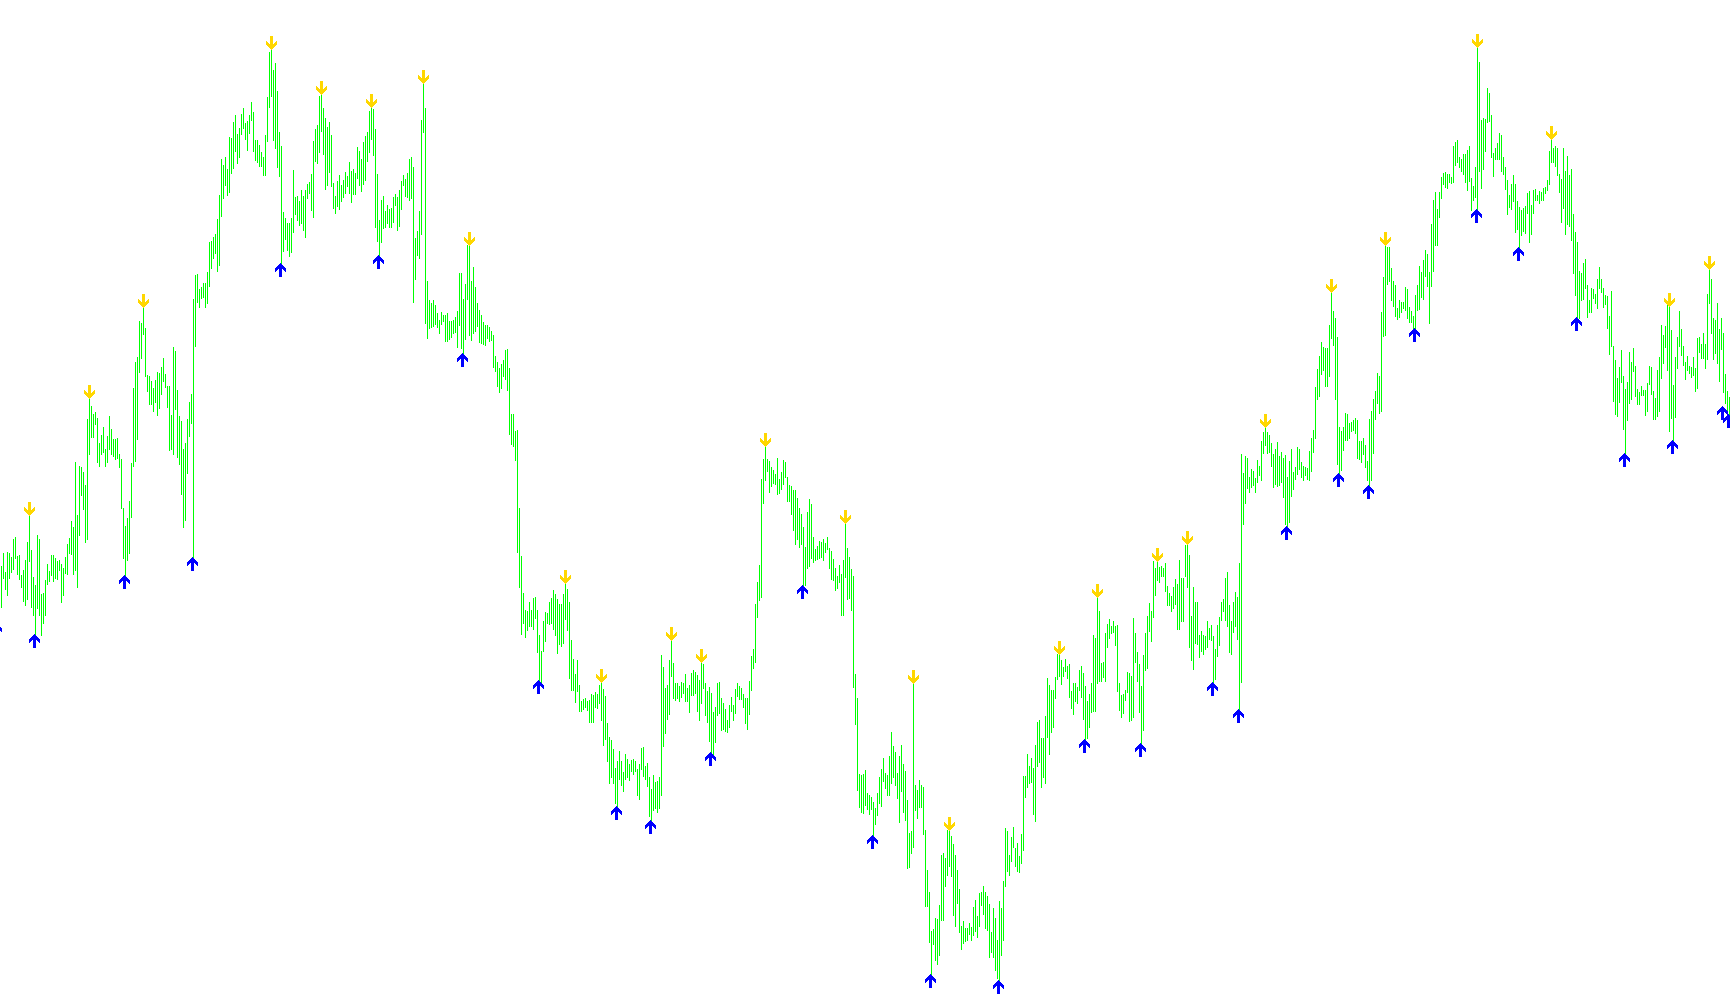
This tool is designed to provide visual markers on your trading chart to help identify significant price peaks and valleys. It automatically scans the historical data of your price movements to pinpoint specific high and low points over a defined period, making it easier to see where the market has reached local extremes.
How the Logic Works
The script functions by constantly looking at "windows" of price action. Instead of just looking at the most recent candle, it examines a group of consecutive bars (a set distance) to determine the highest and lowest points within that specific range.
1. Identifying Peaks (Highs) The tool scans the high prices across this window. When it finds a candle that holds the highest price in that period, it places a visual marker (an arrow) just above that point. This helps you quickly identify where the market reached a temporary ceiling.
2. Identifying Valleys (Lows) Simultaneously, the tool scans the low prices across the same window. When it finds a candle that hits the lowest price in that period, it places a visual marker (an arrow) just below that point. This highlights where the market found a temporary floor.
3. Visual Clarity and Spacing To ensure the markers do not overlap with the actual candles or price bars, the script includes a customizable "Signal Gap." This creates a small amount of breathing room between the indicator's arrow and the candle, ensuring the chart remains clean and easy to read while you are making your analysis.
Summary for the Trader
In simple terms, this tool acts as an automated "high/low" finder. It filters out minor price fluctuations and places distinct arrows on the chart to highlight the most significant turning points in a specific area of the market history. This allows you to see the structure of the price action more clearly at a glance.
//+------------------------------------------------------------------+
//|                                                T&C Wonders.mq4 |
//|                Copyright ©2008, info@fxboom.com          |
//+------------------------------------------------------------------+
#property copyright "Copyright © 2009, Fx Boom"
#property link      "http://www.Fxboom.com/"

#property indicator_chart_window
#property indicator_buffers 2
#property indicator_color1 Red
#property indicator_color2 Aqua

extern int SignalGap = 10;

int dist=24;
double b1[];
double b2[];

int init()  {
   SetIndexStyle(0,DRAW_ARROW,STYLE_SOLID,1);
   SetIndexStyle(1,DRAW_ARROW,STYLE_SOLID,1);
   SetIndexArrow(1,233);
   SetIndexArrow(0,234);
   SetIndexBuffer(0,b1);
   SetIndexBuffer(1,b2);
   return(0);
}
int start() {
   int counted_bars=IndicatorCounted();
   int k,i,j,limit,hhb,llb;

   if (counted_bars<0) return(-1);
   if (counted_bars>0) counted_bars--;
   limit=Bars-1;
   if(counted_bars>=1) limit=Bars-counted_bars-1;
   if (limit<0) limit=0;

   for (i=limit;i>=0;i--)   {
      hhb = Highest(NULL,0,MODE_HIGH,dist,i-dist/2);
      llb = Lowest(NULL,0,MODE_LOW,dist,i-dist/2);

      if (i==hhb)
         b1[i]=High[hhb]+SignalGap*Point;
      if (i==llb)
         b2[i]=Low[llb]-SignalGap*Point;
   }
   return(0);
}
Comments