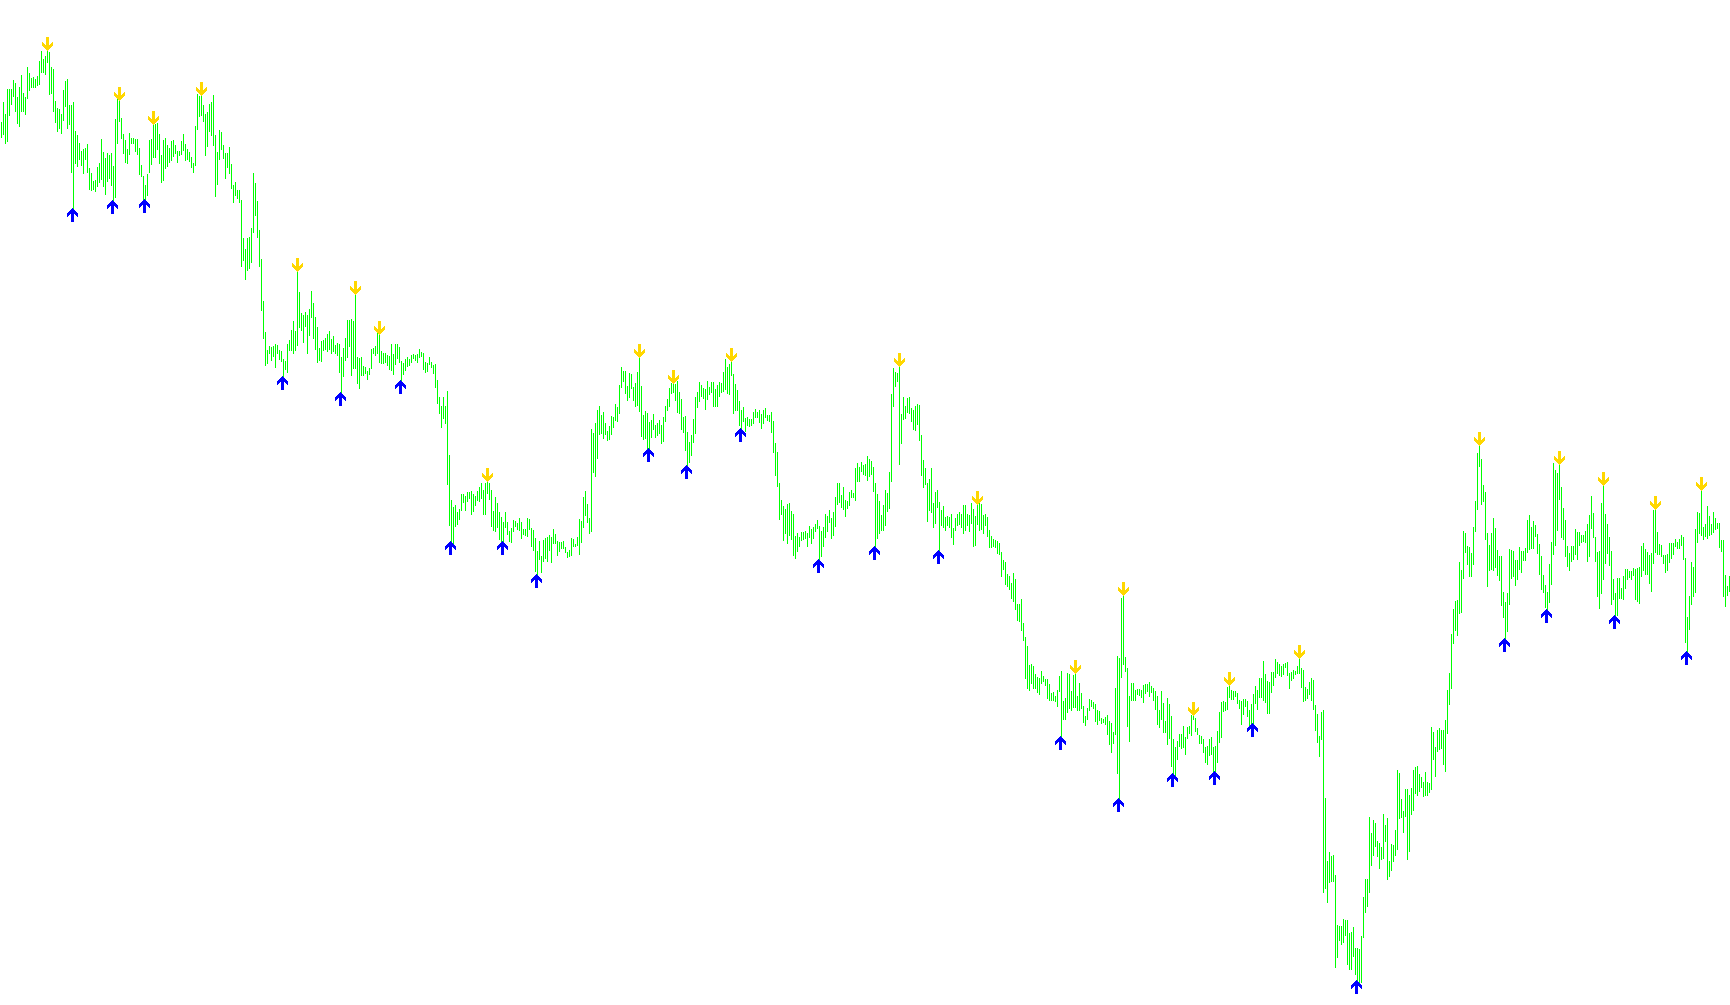
This script is designed as a visual aid for traders to identify significant price turning points on a trading chart. Instead of providing complex mathematical formulas, it focuses on identifying "extreme" price movements within a specific timeframe to help highlight areas where the market may be reaching a peak or a trough.
How the Logic Works
The tool scans the historical price data by looking at specific "windows" of time. In this case, it examines a range of 24 bars (candles) at a time. Its primary goal is to pinpoint the highest high and the lowest low within those specific segments.
Identifying High Points (Sell Signals) The script constantly monitors the price peaks. Whenever it detects that a specific candle represents the highest point reached within its immediate neighborhood, it places a visual marker (an arrow) above that candle. This helps traders quickly spot potential resistance levels where the price has pushed to its limit.
Identifying Low Points (Buy Signals) Simultaneously, the script monitors the price troughs. When it identifies a candle that represents the lowest point reached within its immediate neighborhood, it places a different visual marker below that candle. These indicators are intended to highlight potential support levels where the price has bottomed out.
Key Features for the User
- Visual Guidance: The script automatically draws arrows directly on your chart, removing the need to manually scan every candle to find price extremes.
- Contextual Awareness: By using a fixed distance (24 bars), the tool ensures that it is identifying "local" highs and lows relative to the immediate surrounding price action, rather than just searching for the highest point in the entire history of the chart.
- Clear Distinction: The logic separates "highs" and "lows" into two distinct visual categories, allowing you to differentiate between potential downward pressure and upward momentum at a glance.
//+------------------------------------------------------------------+
//|                                                super-signals.mq4 |
//|                Copyright © 2006, Nick Bilak, beluck[AT]gmail.com |
//+------------------------------------------------------------------+
#property copyright "Copyright © 2006, Nick Bilak"
#property link      "http://www.forex-tsd.com/"

#property indicator_chart_window
#property indicator_buffers 2
#property indicator_color1 Red
#property indicator_color2 Aqua

int dist=24;
double b1[];
double b2[];

int init()  {
   SetIndexStyle(0,DRAW_ARROW,STYLE_SOLID,1);
   SetIndexStyle(1,DRAW_ARROW,STYLE_SOLID,1);
   SetIndexArrow(1,233);
   SetIndexArrow(0,234);
   SetIndexBuffer(0,b1);
   SetIndexBuffer(1,b2);
   return(0);
}
int start() {
   int counted_bars=IndicatorCounted();
   int k,i,j,limit,hhb,llb;

   if (counted_bars<0) return(-1);
   if (counted_bars>0) counted_bars--;
   limit=Bars-1;
   if(counted_bars>=1) limit=Bars-counted_bars-1;
   if (limit<0) limit=0;

   for (i=limit;i>=0;i--)   {
      hhb = Highest(NULL,0,MODE_HIGH,dist,i-dist/2);
      llb = Lowest(NULL,0,MODE_LOW,dist,i-dist/2);

      if (i==hhb)
         b1[i]=High[hhb]+10*Point;
      if (i==llb)
         b2[i]=Low[llb]-10*Point;
   }
   return(0);
}
Comments