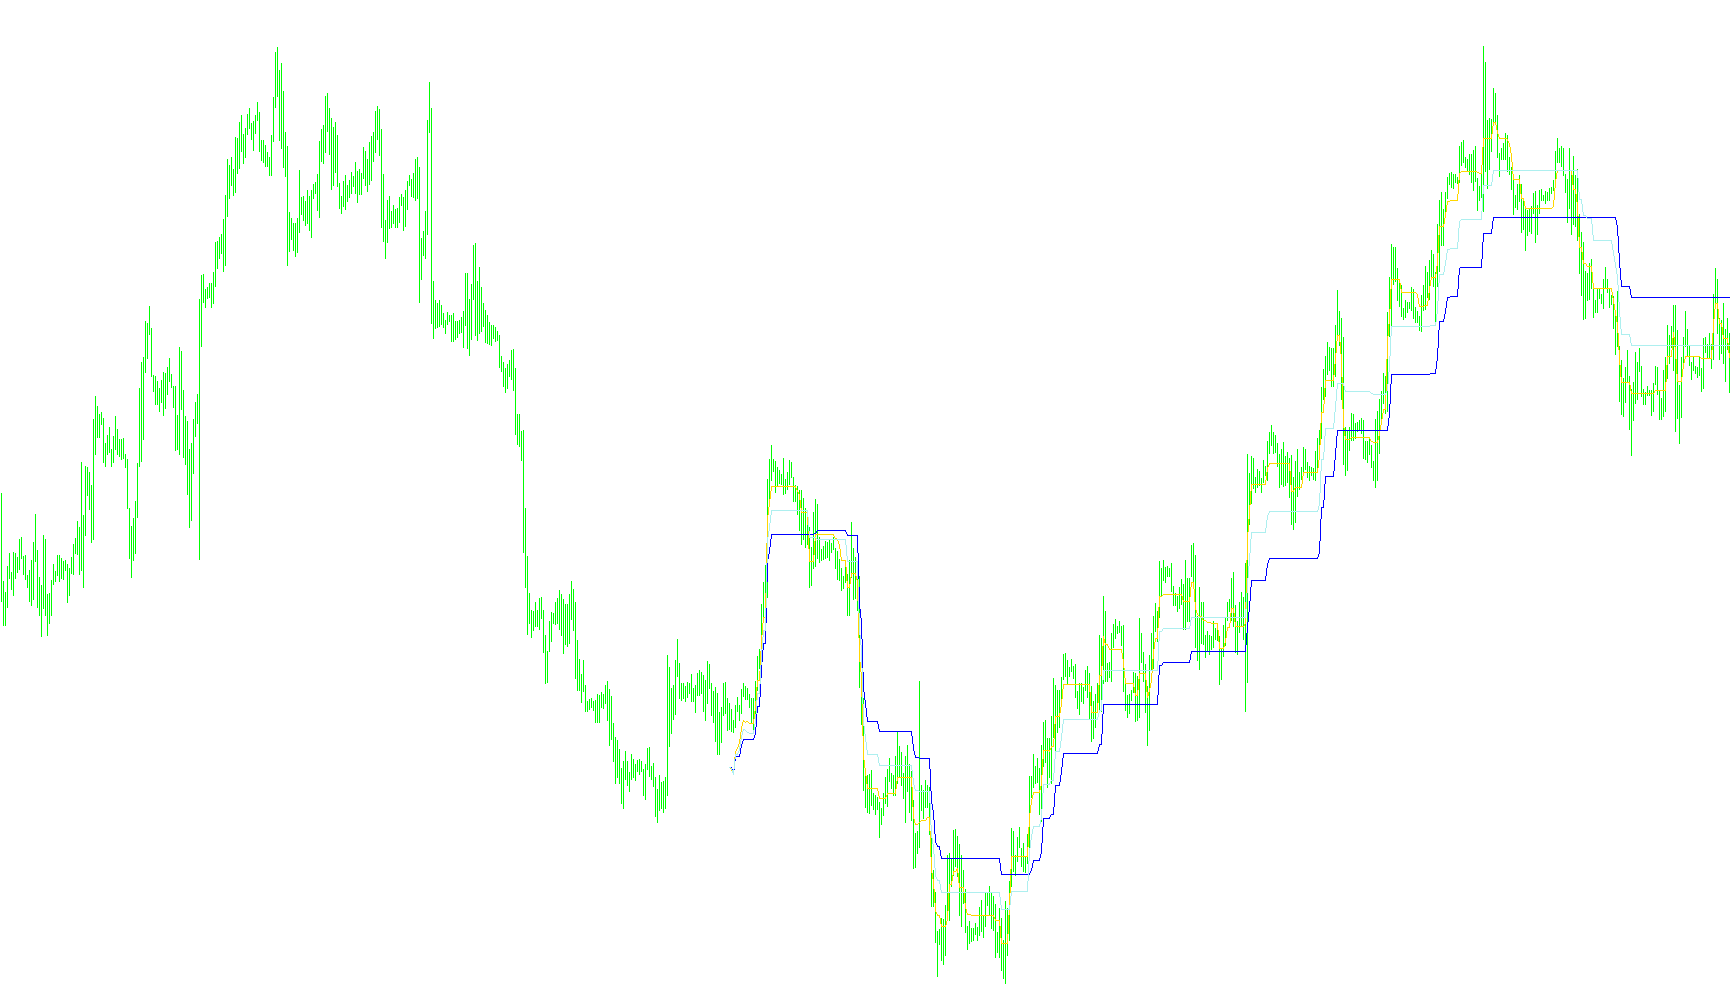
The StepMA_v2 is a specialized technical analysis indicator designed to visualize price trends by creating "stepped" moving averages. Unlike traditional moving averages that move fluidly with every price tick, this tool identifies specific price levels and holds them until a significant enough move occurs to trigger a "step" to a new level.
Here is a breakdown of the logic used by this script:
1. Volatility Measurement
The script begins by analyzing recent market activity to determine how much the price is currently moving. It calculates a weighted average of the range (the difference between the highest and lowest prices) over a specific period. This allows the indicator to be "dynamic"—it understands whether the market is currently experiencing high volatility or quiet consolidation.
2. Dynamic Step Sizing
Based on that volatility measurement, the script establishes three different "Step Sizes":
- Minimum: A smaller step for tight, low-volatility movements.
- Maximum: A larger step for wide, high-volatility swings.
- Mid: A balanced step for standard market conditions.
By using these three different scales simultaneously, the indicator can provide a nuanced view of the market, showing both the minor "noise" and the major structural shifts in price.
3. Trend Detection Logic
The script monitors the closing price to determine the current direction of the trend. It compares the current price against the boundaries created by the three step sizes (Min, Mid, and Max).
- If the price breaks above a boundary, it registers an upward trend.
- If the price falls below a boundary, it registers a downward trend.
4. The "Step" Mechanism
This is the core logic of the tool. Instead of updating the line every time the price moves slightly, the indicator uses a "memory" system:
- Trend Continuity: As long as the trend remains in one direction (e.g., Up), the indicator will only move to a higher step if the new price level is higher than the previous one. It refuses to "drop" or move backward unless the underlying trend actually flips.
- Visual Output: This results in three distinct lines on your chart. These lines stay perfectly flat (horizontal) until the price moves enough to overcome the calculated "Step Size," at which point they jump to the next level like a staircase.
Summary for the User
Think of this indicator as a way to filter out market "noise." By using three different step sizes, it allows you to see multiple layers of trends at once: one that reacts quickly to small changes (Minimum), one that ignores minor fluctuations (Mid), and one that only reacts to major structural shifts (Maximum). It provides a visual "staircase" that helps traders identify the prevailing direction of the market without being distracted by every minor price wiggle.
//+------------------------------------------------------------------+
//|                                                    StepMA_v2.mq4 |
//|                           Copyright © 2005, TrendLaboratory Ltd. |
//|                                       E-mail: igorad2004@list.ru |
//+------------------------------------------------------------------+
#property copyright "Copyright © 2005, TrendLaboratory Ltd."
#property link      "E-mail: igorad2004@list.ru"

#property indicator_chart_window
#property indicator_buffers 3
#property indicator_color1 Yellow
#property indicator_color2 DeepSkyBlue
#property indicator_color3 Tomato
//---- input parameters
extern int PeriodWATR=10;
extern double Kwatr=1.0000;
extern int AdvanceMin=0;
extern int AdvanceMax=0;
extern int AdvanceMid=0;
extern int HighLow=0;
extern int maxbars=500;
//---- indicator buffers
double LineMinBuffer[];
double LineMaxBuffer[];
double LineMidBuffer[];
//+------------------------------------------------------------------+
//| Custom indicator initialization function                         |
//+------------------------------------------------------------------+
  int init()
  {
   string short_name;
//---- indicator line
   SetIndexStyle(0,DRAW_LINE,STYLE_SOLID,1);
   SetIndexStyle(1,DRAW_LINE,STYLE_SOLID,1);
   SetIndexStyle(2,DRAW_LINE,STYLE_SOLID,1);
   SetIndexShift(0,AdvanceMin);
   SetIndexShift(1,AdvanceMax);
   SetIndexShift(2,AdvanceMid);
   SetIndexBuffer(0,LineMinBuffer);
   SetIndexBuffer(1,LineMaxBuffer);
   SetIndexBuffer(2,LineMidBuffer);
   IndicatorDigits(MarketInfo(Symbol(),MODE_DIGITS));
//---- name for DataWindow and indicator subwindow label
   short_name="StepMA 3D("+PeriodWATR+")";
   IndicatorShortName(short_name);
   SetIndexLabel(0,"StepMA min");
   SetIndexLabel(1,"StepMA max");
   SetIndexLabel(2,"StepMA mid");
//----
   SetIndexDrawBegin(0,PeriodWATR);
   SetIndexDrawBegin(1,PeriodWATR);
   SetIndexDrawBegin(2,PeriodWATR);
//----
   return(0);
  }

//+------------------------------------------------------------------+
//| StepMA_3D_v1                                                         |
//+------------------------------------------------------------------+
int start()
  {
   int      i,shift,TrendMin,TrendMax,TrendMid;
   double   SminMin0,SmaxMin0,SminMin1,SmaxMin1,SumRange,dK,WATR0,WATRmax=0,WATRmin=1000000,WATRmid;
   double   SminMax0,SmaxMax0,SminMax1,SmaxMax1,SminMid0,SmaxMid0,SminMid1,SmaxMid1;


   for(shift=maxbars-1;shift>=0;shift--)
   {
	SumRange=0;
	for (i=PeriodWATR-1;i>=0;i--)
	    {
       dK = 1.0+1.0*(PeriodWATR-i)/PeriodWATR;
       SumRange+= dK*MathAbs(High[i+shift]-Low[i+shift]);
       //Print(" dK= ",dK);
       }
	WATR0 = SumRange/PeriodWATR;

	WATRmax=MathMax(WATR0,WATRmax);
	//if (shift==maxbars-1-PeriodWATR) WATRmin=WATR0;
	WATRmin=MathMin(WATR0,WATRmin);

	int StepSizeMin=MathRound(Kwatr*WATRmin/Point);
	int StepSizeMax=MathRound(Kwatr*WATRmax/Point);
	int StepSizeMid=MathRound(Kwatr*0.5*(WATRmax+WATRmin)/Point);

	Comment(" StepSize_min = ", StepSizeMin,"\n",
	        " StepSize_mid = ", StepSizeMid,"\n",
	        " StepSize_max = ", StepSizeMax);

	if (HighLow>0)
	  {
	  SmaxMin0=Low[shift]+2*StepSizeMin*Point;
	  SminMin0=High[shift]-2*StepSizeMin*Point;

	  SmaxMax0=Low[shift]+2*StepSizeMax*Point;
	  SminMax0=High[shift]-2*StepSizeMax*Point;

	  SmaxMid0=Low[shift]+2*StepSizeMid*Point;
	  SminMid0=High[shift]-2*StepSizeMid*Point;

	  if(Close[shift]>SmaxMin1) TrendMin=1;
	  if(Close[shift]<SminMin1) TrendMin=-1;

	  if(Close[shift]>SmaxMax1) TrendMax=1;
	  if(Close[shift]<SminMax1) TrendMax=-1;

	  if(Close[shift]>SmaxMid1) TrendMid=1;
	  if(Close[shift]<SminMid1) TrendMid=-1;
	  }

	if (HighLow == 0)
	  {
	  SmaxMin0=Close[shift]+2*StepSizeMin*Point;
	  SminMin0=Close[shift]-2*StepSizeMin*Point;

	  SmaxMax0=Close[shift]+2*StepSizeMax*Point;
	  SminMax0=Close[shift]-2*StepSizeMax*Point;

	  SmaxMid0=Close[shift]+2*StepSizeMid*Point;
	  SminMid0=Close[shift]-2*StepSizeMid*Point;

	  if(Close[shift]>SmaxMin1) TrendMin=1;
	  if(Close[shift]<SminMin1) TrendMin=-1;

	  if(Close[shift]>SmaxMax1) TrendMax=1;
	  if(Close[shift]<SminMax1) TrendMax=-1;

	  if(Close[shift]>SmaxMid1) TrendMid=1;
	  if(Close[shift]<SminMid1) TrendMid=-1;
	  }

	  if(TrendMin>0 && SminMin0<SminMin1) SminMin0=SminMin1;
	  if(TrendMin<0 && SmaxMin0>SmaxMin1) SmaxMin0=SmaxMin1;

	  if(TrendMax>0 && SminMax0<SminMax1) SminMax0=SminMax1;
	  if(TrendMax<0 && SmaxMax0>SmaxMax1) SmaxMax0=SmaxMax1;

	  if(TrendMid>0 && SminMid0<SminMid1) SminMid0=SminMid1;
	  if(TrendMid<0 && SmaxMid0>SmaxMid1) SmaxMid0=SmaxMid1;


	  if (TrendMin>0) LineMinBuffer[shift]=SminMin0+StepSizeMin*Point;
	  if (TrendMin<0) LineMinBuffer[shift]=SmaxMin0-StepSizeMin*Point;

	  if (TrendMax>0) LineMaxBuffer[shift]=SminMax0+StepSizeMax*Point;
	  if (TrendMax<0) LineMaxBuffer[shift]=SmaxMax0-StepSizeMax*Point;

	  if (TrendMid>0) LineMidBuffer[shift]=SminMid0+StepSizeMid*Point;
	  if (TrendMid<0) LineMidBuffer[shift]=SmaxMid0-StepSizeMid*Point;

	  SminMin1=SminMin0;
	  SmaxMin1=SmaxMin0;

	  SminMax1=SminMax0;
	  SmaxMax1=SmaxMax0;

	  SminMid1=SminMid0;
	  SmaxMid1=SmaxMid0;
	 }
	return(0);
 }
Comments