10Min_RsiSto_01_v1
Download script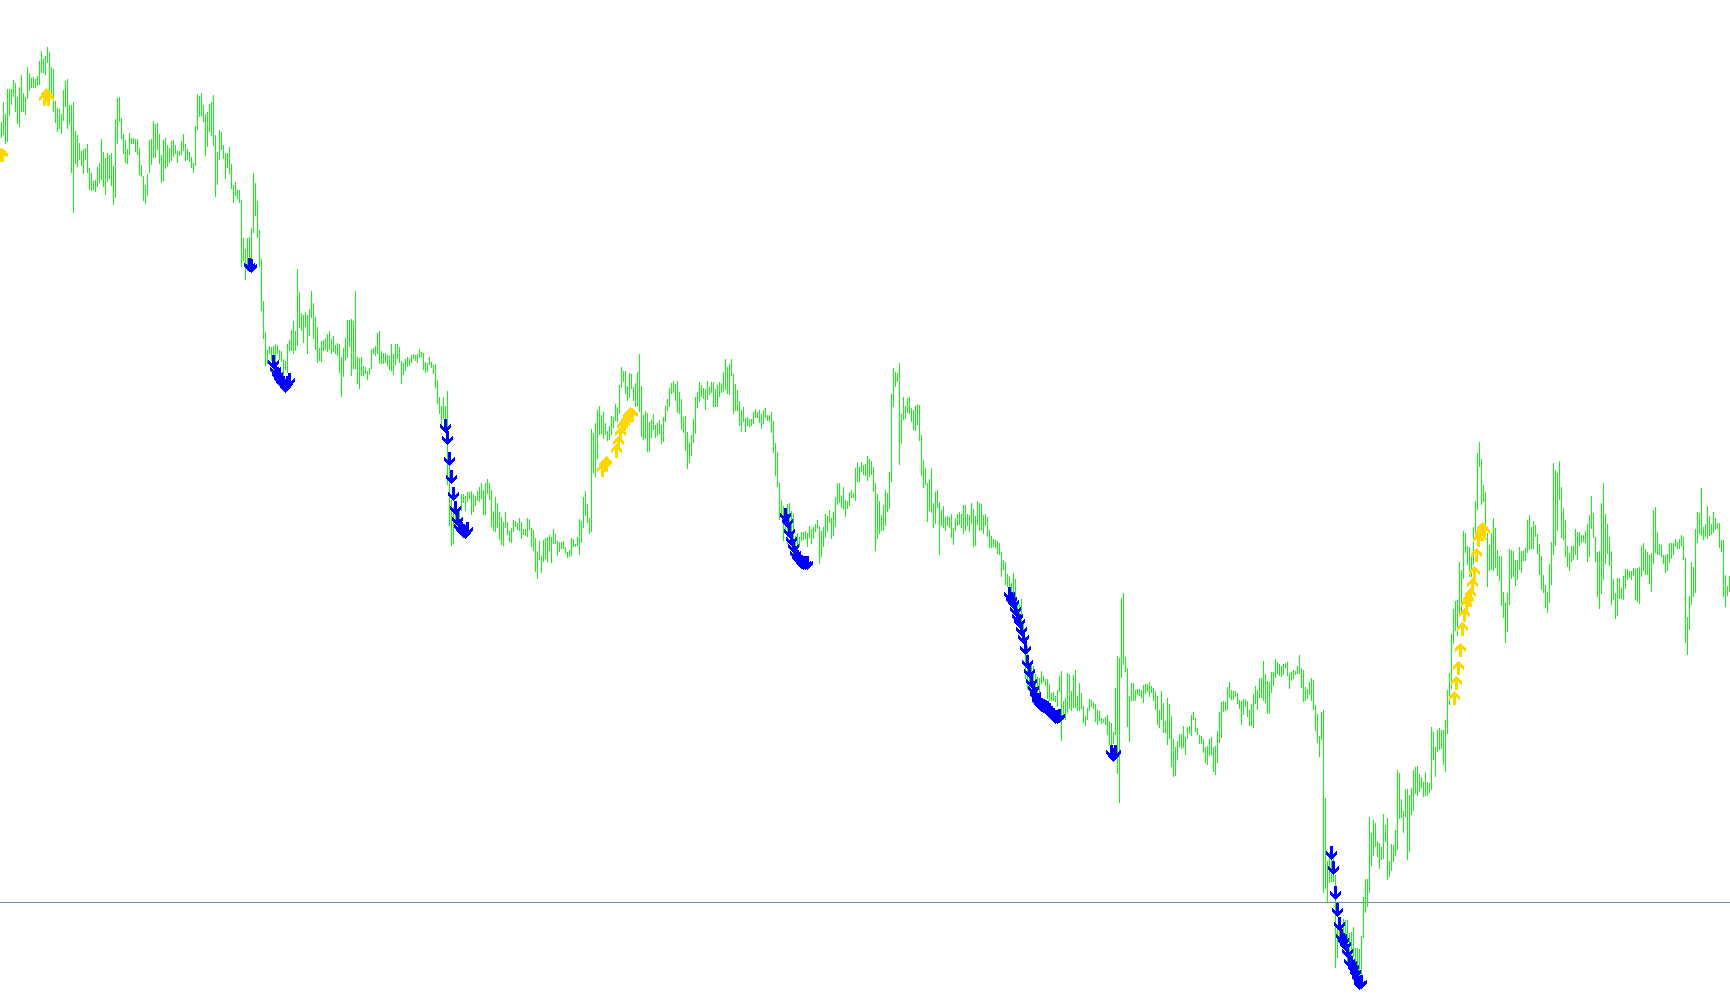
The "10 Minute Trader" is a specialized technical analysis tool designed to identify specific market momentum and trend shifts. Rather than providing a single signal, it monitors multiple financial indicators simultaneously to ensure that trading entries align with broader market conditions.
Core Analytical Logic
The script functions by evaluating four primary types of market data: Moving Averages, Stochastic Oscillators, Relative Strength Index (RSI), and MACD. However, its active decision-making logic focuses primarily on the relationship between Relative Strength (RSI) and Stochastic Momentum.
The tool looks for "extreme" market conditions where price action has pushed significantly in one direction, creating potential opportunities for a reversal or a continuation of a strong move.
Signal Identification
The script places visual markers on the chart based on two specific scenarios:
1. Overbought Conditions (Potential Sell Signals) The indicator looks for a cluster of high-intensity data points. It triggers a signal when:
- The RSI has remained consistently high (above 60) across four consecutive time periods.
- The Stochastic Momentum has simultaneously stayed in an overbought zone (above 80) for the same duration.
- When both conditions are met, a specific visual marker appears relative to the Weighted Moving Average.
2. Oversold Conditions (Potential Buy Signals) Conversely, the tool identifies areas where the market may be "exhausted" to the downside. It triggers a signal when:
- The RSI has remained consistently low (below 40) for four consecutive time periods.
- The Stochastic Momentum has simultaneously stayed in an oversold zone (below 20) for the same duration.
- When these conditions align, a different visual marker is placed on the chart to highlight the opportunity.
Key Technical Components
- Trend Filtering: While the moving averages (Weighted and Simple) are calculated in the background, they serve as the baseline for placing the visual signals.
- Momentum Verification: By requiring the indicator to check four consecutive periods of data (rather than just the current moment), the script filters out "noise" and ensures that the market is showing a sustained trend before providing a signal.
- Visual Output: The script translates these complex mathematical conditions into easy-to-read symbols on your trading chart, allowing you to see potential entry points at a glance without manually calculating RSI or Stochastic levels.
/*-----------------------------+
|			       |
| Shared by www.Aptrafx.com    |
|			       |
+------------------------------*/

//+------------------------------------------------------------------+
//| 10 Minute trader                                                 |
//+------------------------------------------------------------------+
#property copyright "Ron T"
#property link      "http://www.lightpatch.com"

#property indicator_chart_window
#property indicator_buffers 6
#property indicator_color1 White  // arrow up for moving average
#property indicator_color2 White  // arrow down for moving average
#property indicator_color3 Aqua   // box for stoch
#property indicator_color4 Red    // box for rsi
#property indicator_color5 White  // box for macd
#property indicator_color6 White  // dot for early stoch cross

//---- buffers
double ExtMapBuffer1[];
double ExtMapBuffer2[];
double ExtMapBuffer3[];
double ExtMapBuffer4[];
double ExtMapBuffer5[];
double ExtMapBuffer6[];


// User Input


//+------------------------------------------------------------------+
//| Custom indicator initialization function                         |
//|------------------------------------------------------------------|

int init()
  {

   // 233 up arrow
   // 234 down arrow
   // 159 big dot
   // 168 open square

   SetIndexStyle(0,DRAW_ARROW);
   SetIndexBuffer(0, ExtMapBuffer1);
   SetIndexArrow(0,233);  //up

   SetIndexStyle(1,DRAW_ARROW);
   SetIndexBuffer(1, ExtMapBuffer2);
   SetIndexArrow(1,234);  //down

   SetIndexStyle(2,DRAW_ARROW);
   SetIndexBuffer(2, ExtMapBuffer3);
   SetIndexArrow(2,168);  //open square

   SetIndexStyle(3,DRAW_ARROW);
   SetIndexBuffer(3, ExtMapBuffer4);
   SetIndexArrow(3,168);  //open square

   SetIndexStyle(4,DRAW_ARROW);
   SetIndexBuffer(4, ExtMapBuffer5);
   SetIndexArrow(4,168);  //open square

   SetIndexStyle(5,DRAW_ARROW);
   SetIndexBuffer(5, ExtMapBuffer6);
   SetIndexArrow(5,159);  //dot

   return(0);
  }


//+------------------------------------------------------------------+
//| Custor indicator deinitialization function                       |
//+------------------------------------------------------------------+
int deinit()
  {
   int i;

   for( i=0; i<Bars; i++ ) ExtMapBuffer1[i]=0;
   for( i=0; i<Bars; i++ ) ExtMapBuffer2[i]=0;
   for( i=0; i<Bars; i++ ) ExtMapBuffer3[i]=0;
   for( i=0; i<Bars; i++ ) ExtMapBuffer4[i]=0;
   for( i=0; i<Bars; i++ ) ExtMapBuffer5[i]=0;
   for( i=0; i<Bars; i++ ) ExtMapBuffer6[i]=0;

   return(0);
  }


//+------------------------------------------------------------------+
//| Custom indicator iteration function                              |
//+------------------------------------------------------------------+
int start()
  {
   double    wma=0,    wma_p=0;  // linear Weighted Moving Average & Previous
   double    sma=0,    sma_p=0;  // Simple Moving Average & Previous
   double stochm=0, stochm_p=0;  // STOCHastic Main & Previous
   double stochs=0, stochs_p=0;  // STOCHastic Signal
   double  macdm=0;              // Moving Average Convergance Divergance Main
   double  macds=0;              // Moving Average Convergance Divergance Signal
   double    rsi=0;              // Relative Strength Indicator
   double   rsi1=0,     rsi2=0;  // 1st 2 periods of past history
   double   rsi3=0,     rsi4=0;  // 2nd 2 periods
   double stochm1=0, stochm2=0;
   double stochm3=0, stochm4=0;

   int pos=Bars-100;             // leave room for moving average periods

   while(pos>=0)
     {

      wma_p=wma; // save previous calculations
      wma=iMA(Symbol(),0,10,0,MODE_LWMA,PRICE_CLOSE,pos);

      sma_p=sma; // save previous calculations
      sma=iMA(Symbol(),0,20,0,MODE_SMA,PRICE_CLOSE,pos);

      stochm=iStochastic(Symbol(),0,10,6,6,0,1,0,pos);
      stochs=iStochastic(Symbol(),0,10,6,6,0,1,1,pos);
      stochm1=iStochastic(Symbol(),0,10,6,6,0,1,0,pos+1);
      stochm2=iStochastic(Symbol(),0,10,6,6,0,1,0,pos+2);
      stochm3=iStochastic(Symbol(),0,10,6,6,0,1,0,pos+3);
      stochm4=iStochastic(Symbol(),0,10,6,6,0,1,0,pos+4);

      rsi=iRSI(Symbol(),0,28,PRICE_CLOSE,pos);
      rsi1=iRSI(Symbol(),0,28,PRICE_CLOSE,pos+1);
      rsi2=iRSI(Symbol(),0,28,PRICE_CLOSE,pos+2);
      rsi3=iRSI(Symbol(),0,28,PRICE_CLOSE,pos+3);
      rsi4=iRSI(Symbol(),0,28,PRICE_CLOSE,pos+4);

      macdm=iMACD(Symbol(),0,24,52,18,0,0,pos);
      macds=iMACD(Symbol(),0,24,52,18,0,1,pos);

      // RISING stochastic cross
      // if (stochm_p>stochm && stochs_p<stochs && stochs>stochm)

      // FALLING stochastic cross
      // if (stochm_p<stochm && stochs_p>stochs && stochs<stochm)


      if (rsi1>60 && rsi2>60 && rsi3>60 && rsi4>60 )
        {
         if (stochm1>80 && stochm2>80 && stochm3>80 && stochm4>80 )                               //red
           {
            ExtMapBuffer1[pos]=wma - 0.0011;
           }
        }

      if (rsi1<40 && rsi2<40 && rsi3<40 && rsi4<40 )
        {
         if (stochm1<20 && stochm2<20 && stochm3<20 && stochm4<20 )                               //red
           {
            ExtMapBuffer2[pos]=wma - 0.0011;
           }
        }


 	   pos--;
     }

   return(0);
  }
//+------------------------------------------------------------------+
Comments