10Min_RsiSto_01
Download script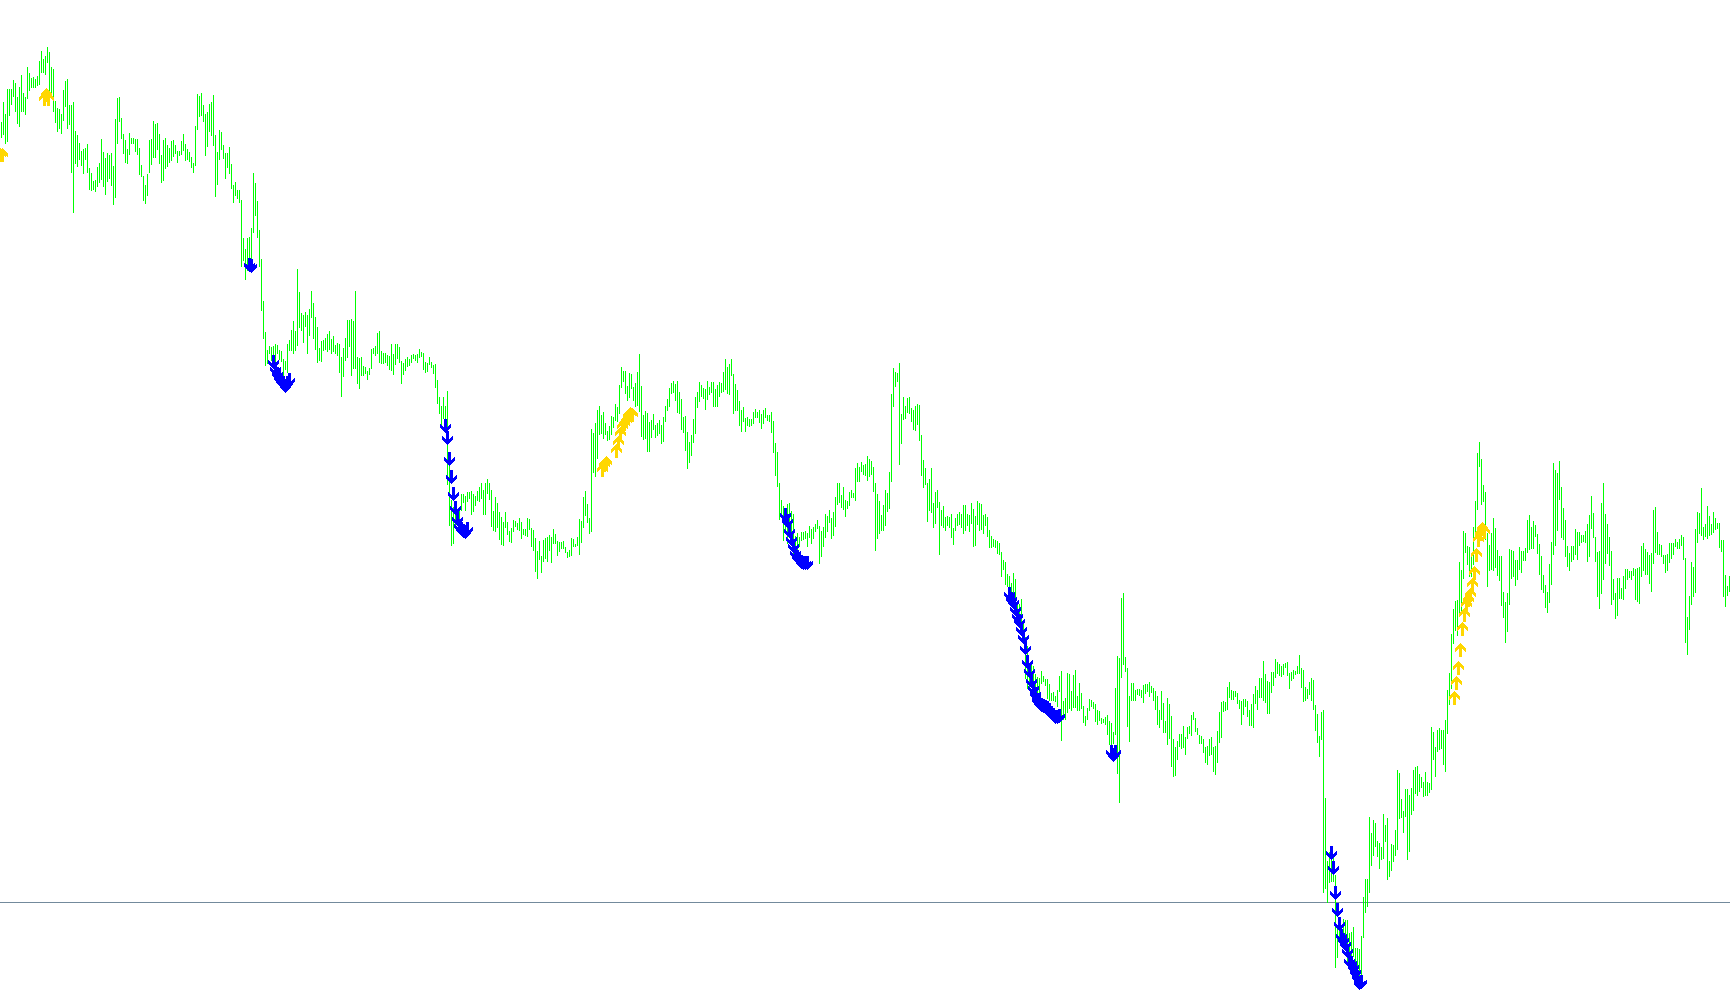
The "10 Minute trader" is a custom technical analysis tool designed to help traders identify specific high-probability market conditions by combining multiple momentum and trend indicators. Instead of relying on a single piece of data, this script looks for "confluence"—a situation where several different mathematical models agree on the market's direction simultaneously.
Core Logic Overview
The script scans historical price data to identify extreme conditions in two specific directions: overbought levels (where prices might be too high) and oversold levels (where prices might be too low). It uses a "multi-bar confirmation" approach, meaning it doesn't just look at what is happening right now; it checks the status of the market over several preceding candles to ensure a trend is stable.
How the Signals are Generated
1. The Momentum Filter (RSI) The script utilizes the Relative Strength Index (RSI) to determine the current strength of price movements. It specifically looks for sustained momentum by checking if the RSI has remained consistently above a certain threshold (60) or below a certain threshold (40) for four consecutive periods. This ensures that the tool only reacts to established moves rather than temporary spikes.
2. The Exhaustion Filter (Stochastic Oscillator) To complement the RSI, the script uses a Stochastic Oscillator. This is used to identify "exhaustion" points.
- For Bearish Signals: It looks for instances where the Stochastic values have remained consistently above 80 across four consecutive periods while the RSI is high. This suggests the market is overextended to the upside.
- For Bullish Signals: It looks for instances where the Stochastic values have remained consistently below 20 across four consecutive periods while the RSI is low. This suggests the market is overextended to the downside.
3. Visual Output When both the Momentum and Exhaustion conditions are met simultaneously, the script places visual markers on the chart:
- Upward Arrows: These indicate potential opportunities based on the lower-bound exhaustion logic.
- Downward Arrows: These indicate potential opportunities based on the upper-bound exhaustion logic.
Summary of Operation
The script effectively acts as a "filter" for the noise of the market. It ignores standard price fluctuations and only highlights moments where the RSI confirms a strong move and the Stochastic Oscillator indicates that the move may be reaching an extreme point. By requiring these conditions to persist over multiple bars, the logic attempts to filter out "fakeouts" and focus on significant shifts in price momentum.
//+------------------------------------------------------------------+
//| 10 Minute trader                                                 |
//+------------------------------------------------------------------+
#property copyright "Ron T"
#property link      "http://www.lightpatch.com"

#property indicator_chart_window
#property indicator_buffers 6
#property indicator_color1 White  // arrow up for moving average
#property indicator_color2 White  // arrow down for moving average
#property indicator_color3 Aqua   // box for stoch
#property indicator_color4 Red    // box for rsi
#property indicator_color5 White  // box for macd
#property indicator_color6 White  // dot for early stoch cross

//---- buffers
double ExtMapBuffer1[];
double ExtMapBuffer2[];
double ExtMapBuffer3[];
double ExtMapBuffer4[];
double ExtMapBuffer5[];
double ExtMapBuffer6[];


// User Input


//+------------------------------------------------------------------+
//| Custom indicator initialization function                         |
//|------------------------------------------------------------------|

int init()
  {

   // 233 up arrow
   // 234 down arrow
   // 159 big dot
   // 168 open square

   SetIndexStyle(0,DRAW_ARROW);
   SetIndexBuffer(0, ExtMapBuffer1);
   SetIndexArrow(0,233);  //up

   SetIndexStyle(1,DRAW_ARROW);
   SetIndexBuffer(1, ExtMapBuffer2);
   SetIndexArrow(1,234);  //down

   SetIndexStyle(2,DRAW_ARROW);
   SetIndexBuffer(2, ExtMapBuffer3);
   SetIndexArrow(2,168);  //open square

   SetIndexStyle(3,DRAW_ARROW);
   SetIndexBuffer(3, ExtMapBuffer4);
   SetIndexArrow(3,168);  //open square

   SetIndexStyle(4,DRAW_ARROW);
   SetIndexBuffer(4, ExtMapBuffer5);
   SetIndexArrow(4,168);  //open square

   SetIndexStyle(5,DRAW_ARROW);
   SetIndexBuffer(5, ExtMapBuffer6);
   SetIndexArrow(5,159);  //dot

   return(0);
  }


//+------------------------------------------------------------------+
//| Custor indicator deinitialization function                       |
//+------------------------------------------------------------------+
int deinit()
  {
   int i;

   for( i=0; i<Bars; i++ ) ExtMapBuffer1[i]=0;
   for( i=0; i<Bars; i++ ) ExtMapBuffer2[i]=0;
   for( i=0; i<Bars; i++ ) ExtMapBuffer3[i]=0;
   for( i=0; i<Bars; i++ ) ExtMapBuffer4[i]=0;
   for( i=0; i<Bars; i++ ) ExtMapBuffer5[i]=0;
   for( i=0; i<Bars; i++ ) ExtMapBuffer6[i]=0;

   return(0);
  }


//+------------------------------------------------------------------+
//| Custom indicator iteration function                              |
//+------------------------------------------------------------------+
int start()
  {
   double    wma=0,    wma_p=0;  // linear Weighted Moving Average & Previous
   double    sma=0,    sma_p=0;  // Simple Moving Average & Previous
   double stochm=0, stochm_p=0;  // STOCHastic Main & Previous
   double stochs=0, stochs_p=0;  // STOCHastic Signal
   double  macdm=0;              // Moving Average Convergance Divergance Main
   double  macds=0;              // Moving Average Convergance Divergance Signal
   double    rsi=0;              // Relative Strength Indicator
   double   rsi1=0,     rsi2=0;  // 1st 2 periods of past history
   double   rsi3=0,     rsi4=0;  // 2nd 2 periods
   double stochm1=0, stochm2=0;
   double stochm3=0, stochm4=0;

   int pos=Bars-100;             // leave room for moving average periods

   while(pos>=0)
     {

      wma_p=wma; // save previous calculations
      wma=iMA(Symbol(),0,10,0,MODE_LWMA,PRICE_CLOSE,pos);

      sma_p=sma; // save previous calculations
      sma=iMA(Symbol(),0,20,0,MODE_SMA,PRICE_CLOSE,pos);

      stochm=iStochastic(Symbol(),0,10,6,6,0,1,0,pos);
      stochs=iStochastic(Symbol(),0,10,6,6,0,1,1,pos);
      stochm1=iStochastic(Symbol(),0,10,6,6,0,1,0,pos+1);
      stochm2=iStochastic(Symbol(),0,10,6,6,0,1,0,pos+2);
      stochm3=iStochastic(Symbol(),0,10,6,6,0,1,0,pos+3);
      stochm4=iStochastic(Symbol(),0,10,6,6,0,1,0,pos+4);

      rsi=iRSI(Symbol(),0,28,PRICE_CLOSE,pos);
      rsi1=iRSI(Symbol(),0,28,PRICE_CLOSE,pos+1);
      rsi2=iRSI(Symbol(),0,28,PRICE_CLOSE,pos+2);
      rsi3=iRSI(Symbol(),0,28,PRICE_CLOSE,pos+3);
      rsi4=iRSI(Symbol(),0,28,PRICE_CLOSE,pos+4);

      macdm=iMACD(Symbol(),0,24,52,18,0,0,pos);
      macds=iMACD(Symbol(),0,24,52,18,0,1,pos);

      // RISING stochastic cross
      // if (stochm_p>stochm && stochs_p<stochs && stochs>stochm)

      // FALLING stochastic cross
      // if (stochm_p<stochm && stochs_p>stochs && stochs<stochm)


      if (rsi1>60 && rsi2>60 && rsi3>60 && rsi4>60 )
        {
         if (stochm1>80 && stochm2>80 && stochm3>80 && stochm4>80 )                               //red
           {
            ExtMapBuffer1[pos]=wma - 0.0011;
           }
        }

      if (rsi1<40 && rsi2<40 && rsi3<40 && rsi4<40 )
        {
         if (stochm1<20 && stochm2<20 && stochm3<20 && stochm4<20 )                               //red
           {
            ExtMapBuffer2[pos]=wma - 0.0011;
           }
        }


 	   pos--;
     }

   return(0);
  }
//+------------------------------------------------------------------+
Comments