10Min_2ind
Download script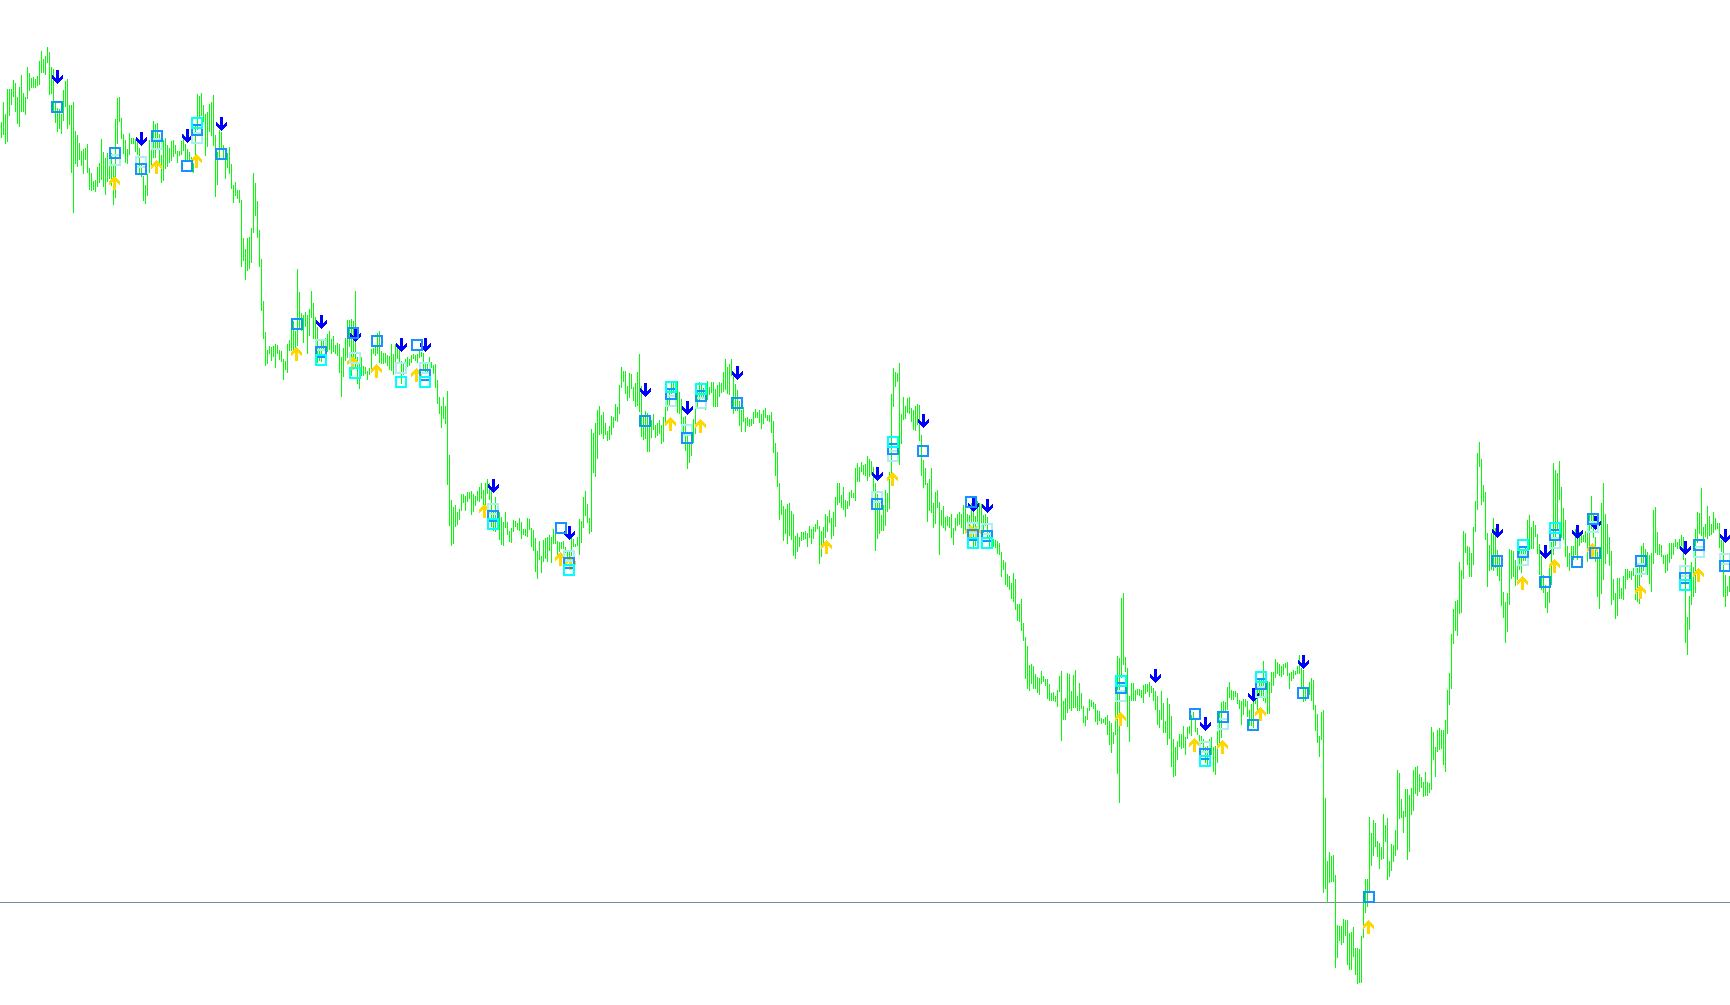
This script is a technical analysis tool designed to provide visual trading signals on a price chart. It functions by monitoring several different mathematical indicators simultaneously to identify specific "crossover" moments where the price trend might be shifting.
Core Logic and Indicators
The tool works by constantly calculating three primary types of market data:
- Moving Averages: The script compares a fast-reacting average (Weighted Moving Average) against a slower, more stable average (Simple Moving Average).
- Stochastic Oscillator: This measures the momentum of price movements to determine if an asset is overbought or oversold.
- Relative Strength Index (RSI): This identifies the speed and change of price movements to help gauge whether a market is becoming overextended.
How the Signals Work
The script looks for specific "trigger" events where these indicators align in a certain way:
1. Trend Detection (The Primary Trigger) The main signal is generated when the fast moving average crosses over the slow moving average.
- If the fast line crosses above the slow line, it indicates a potential upward trend shift.
- If the fast line crosses below the slow line, it indicates a potential downward trend shift.
2. Confirmation Filters (The Visual Markers) Once a primary trend cross is detected, the script checks the RSI and Stochastic values to determine which specific visual markers to place on the chart. These act as secondary confirmations:
- Upward Signals: When an upward cross occurs, the script evaluates the market strength. It places different types of shapes/markers based on whether the RSI is above a certain threshold (showing bullish strength) or if the Stochastic momentum is favorable.
- Downward Signals: Conversely, when a downward cross occurs, it checks if the RSI is low enough and if the Stochastic momentum is bearish. Depending on these conditions, it places specific markers to signal a potential drop in price.
Summary of Visual Output
Instead of just showing lines, the script translates this complex math into clear symbols directly on your chart:
- Arrows: Indicate the primary crossover of the moving averages (the basic trend change).
- Squares/Dots: These appear only when the move is "confirmed" by the additional RSI and Stochastic data, helping the user distinguish between a minor price wiggle and a potentially stronger trend shift.
//+------------------------------------------------------------------+
//| 10 Minute trader                                                 |
//+------------------------------------------------------------------+
#property copyright "Ron T"
#property link      "http://www.lightpatch.com"

#property indicator_chart_window
#property indicator_buffers 6
#property indicator_color1 White  // arrow up for moving average
#property indicator_color2 White  // arrow down for moving average
#property indicator_color3 Aqua   // box for stoch
#property indicator_color4 Red    // box for rsi
#property indicator_color5 White  // box for macd
#property indicator_color6 White  // dot for early stoch cross

//---- buffers
double ExtMapBuffer1[];
double ExtMapBuffer2[];
double ExtMapBuffer3[];
double ExtMapBuffer4[];
double ExtMapBuffer5[];
double ExtMapBuffer6[];


// User Input


//+------------------------------------------------------------------+
//| Custom indicator initialization function                         |
//|------------------------------------------------------------------|

int init()
  {

   // 233 up arrow
   // 234 down arrow
   // 159 big dot
   // 168 open square

   SetIndexStyle(0,DRAW_ARROW);
   SetIndexBuffer(0, ExtMapBuffer1);
   SetIndexArrow(0,233);  //up

   SetIndexStyle(1,DRAW_ARROW);
   SetIndexBuffer(1, ExtMapBuffer2);
   SetIndexArrow(1,234);  //down

   SetIndexStyle(2,DRAW_ARROW);
   SetIndexBuffer(2, ExtMapBuffer3);
   SetIndexArrow(2,168);  //open square

   SetIndexStyle(3,DRAW_ARROW);
   SetIndexBuffer(3, ExtMapBuffer4);
   SetIndexArrow(3,168);  //open square

   SetIndexStyle(4,DRAW_ARROW);
   SetIndexBuffer(4, ExtMapBuffer5);
   SetIndexArrow(4,168);  //open square

   SetIndexStyle(5,DRAW_ARROW);
   SetIndexBuffer(5, ExtMapBuffer6);
   SetIndexArrow(5,159);  //dot

   return(0);
  }


//+------------------------------------------------------------------+
//| Custor indicator deinitialization function                       |
//+------------------------------------------------------------------+
int deinit()
  {
   int i;

   for( i=0; i<Bars; i++ ) ExtMapBuffer1[i]=0;
   for( i=0; i<Bars; i++ ) ExtMapBuffer2[i]=0;
   for( i=0; i<Bars; i++ ) ExtMapBuffer3[i]=0;
   for( i=0; i<Bars; i++ ) ExtMapBuffer4[i]=0;
   for( i=0; i<Bars; i++ ) ExtMapBuffer5[i]=0;
   for( i=0; i<Bars; i++ ) ExtMapBuffer6[i]=0;

   return(0);
  }


//+------------------------------------------------------------------+
//| Custom indicator iteration function                              |
//+------------------------------------------------------------------+
int start()
  {
   double    wma=0,    wma_p=0;  // linear Weighted Moving Average & Previous
   double    sma=0,    sma_p=0;  // Simple Moving Average & Previous
   double stochm=0, stochm_p=0;  // STOCHastic Main & Previous
   double stochs=0, stochs_p=0;  // STOCHastic Signal
   double    rsi=0;              // Relative Strength Indicator
   double   rsi1=0,     rsi2=0;  // 1st 2 periods of past history
   double   rsi3=0,     rsi4=0;  // 2nd 2 periods

   int pos=Bars-100;             // leave room for moving average periods

   while(pos>=0)
     {

      wma_p=wma; // save previous calculations
      wma=iMA(Symbol(),0,10,0,MODE_LWMA,PRICE_CLOSE,pos);

      sma_p=sma; // save previous calculations
      sma=iMA(Symbol(),0,20,0,MODE_SMA,PRICE_CLOSE,pos);

      stochm_p=stochm;
      stochm=iStochastic(Symbol(),0,10,6,6,0,1,0,pos);
      stochs_p=stochs;
      stochs=iStochastic(Symbol(),0,10,6,6,0,1,1,pos);

      rsi=iRSI(Symbol(),0,28,PRICE_CLOSE,pos);
      rsi1=iRSI(Symbol(),0,28,PRICE_CLOSE,pos+1);
      rsi2=iRSI(Symbol(),0,28,PRICE_CLOSE,pos+2);
      rsi3=iRSI(Symbol(),0,28,PRICE_CLOSE,pos+3);
      rsi4=iRSI(Symbol(),0,28,PRICE_CLOSE,pos+4);

      // RISING stochastic cross
      // if (stochm_p>stochm && stochs_p<stochs && stochs>stochm)

      // FALLING stochastic cross
      // if (stochm_p<stochm && stochs_p>stochs && stochs<stochm)


      if ( wma_p < sma_p && wma > sma )
        {
         ExtMapBuffer1[pos]=wma - 0.0006;

         if (rsi > 52 )   //blue
           {
            ExtMapBuffer3[pos]=wma + 0.0003;
           }
         if (stochm > stochs)                                  //red
           {
            ExtMapBuffer4[pos]=wma + 0.0006;
           }
//         if ( rsi>55 && (rsi1<45||rsi2<45||rsi3<45) && (stochm>80||stochs>80) ) //white
         if ( rsi > 55 ) //white
           {
            ExtMapBuffer5[pos]=wma + 0.0009;
           }
        }

      if ( wma_p > sma_p && wma < sma )
        {
         ExtMapBuffer2[pos]=wma + 0.0006;

         if (rsi < 48 )
           {
            ExtMapBuffer3[pos]=wma - 0.0003;
           }
         if (stochm < stochs)
           {
            ExtMapBuffer4[pos]=wma - 0.0006;
           }
//         if ( rsi<45 && (rsi1>55||rsi2>55||rsi3>55) && (stochm<20||stochs<20) ) //white
         if ( rsi < 45 ) //white
           {
            ExtMapBuffer5[pos]=wma - 0.0009;
           }
        }

 	   pos--;
     }

   return(0);
  }
//+------------------------------------------------------------------+
Comments