10Min_012
Download script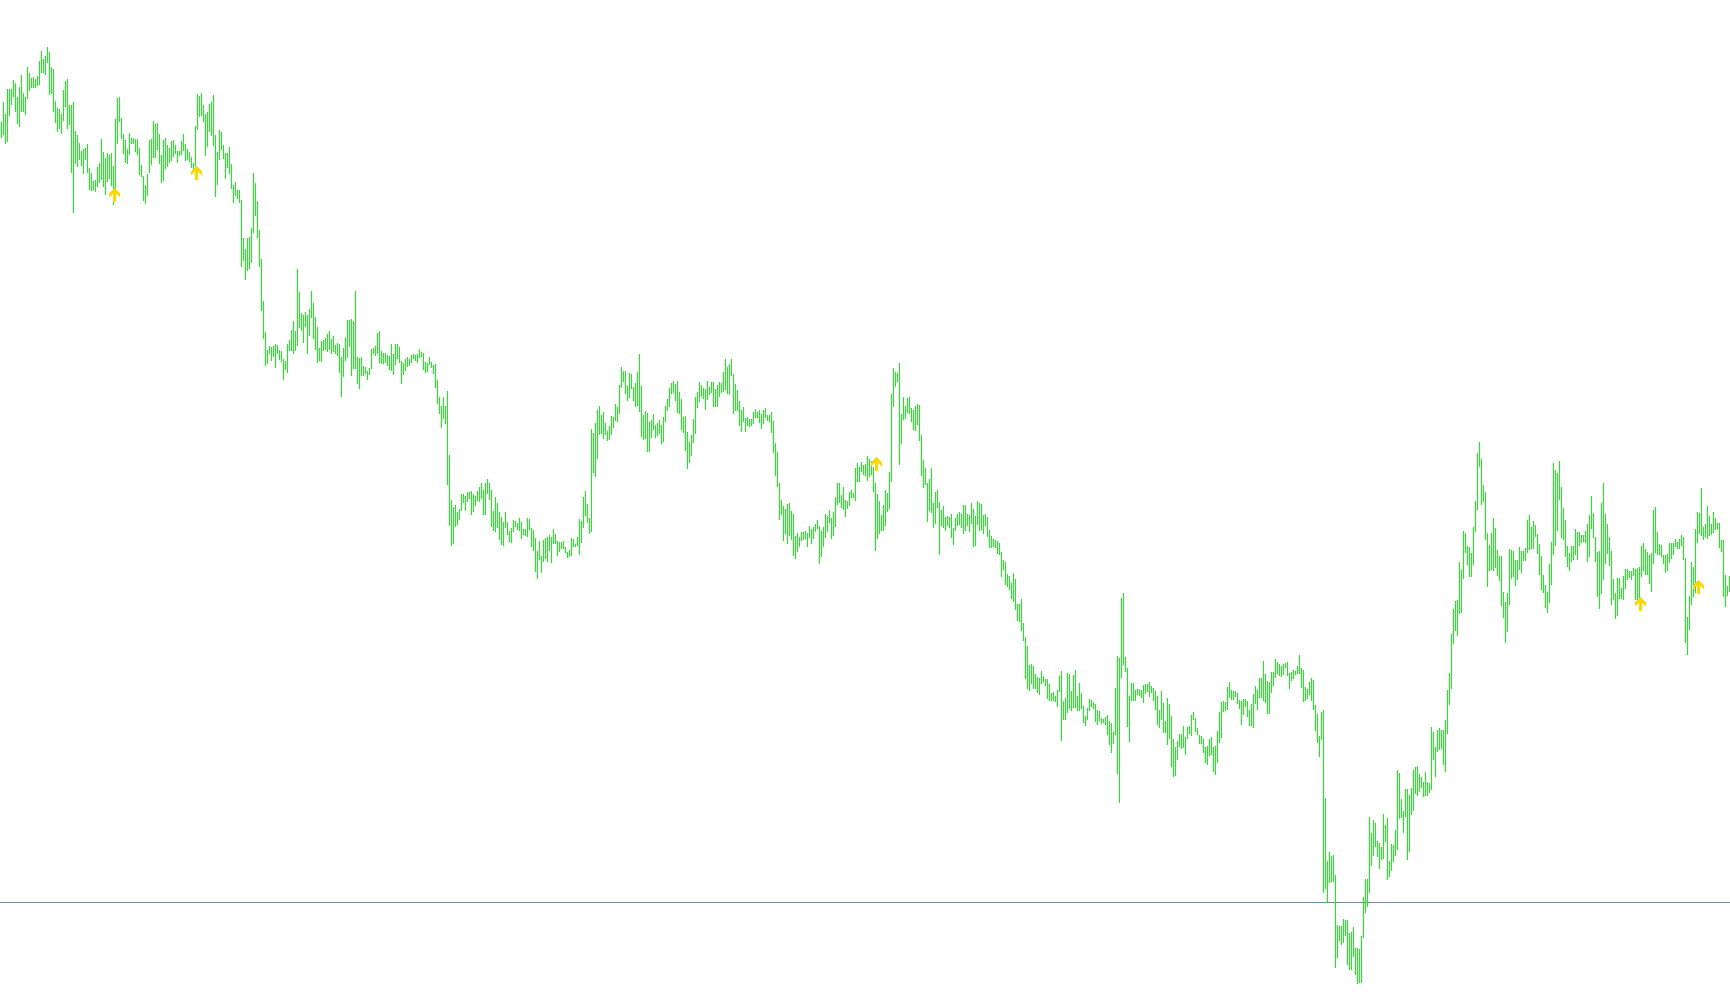
This script is designed as a specialized technical analysis tool for the MetaTrader platform, specifically tailored for traders looking to identify high-probability trend reversals and momentum shifts. Instead of relying on a single indicator, it uses a multi-layered filtering system that combines four different market analysis methods to confirm a signal before displaying it on your chart.
How the Logic Works
The tool functions by scanning historical price data and checking for a specific "confluence"—a situation where multiple independent conditions align simultaneously. It looks for signals based on the following criteria:
1. Trend Direction (Moving Averages) The core of the logic identifies the primary trend using two different types of Moving Averages. It looks for a "crossover" event:
- For Buy Signals: It detects when a fast-moving average crosses upward over a slower moving average, suggesting positive momentum is gaining strength.
- For Sell Signals: It detects when the fast moving average crosses downward under the slower one, suggesting a shift toward bearish momentum.
2. Momentum Confirmation (RSI) To ensure the price movement isn't just a temporary "blip," the script uses the Relative Strength Index (RSI). It checks if the current strength is high enough to support the move, while also looking back at recent history to see if the price has recently come from a different zone. This helps filter out signals that occur when the market is already exhausted.
3. Overbought/Oversold Filtering (Stochastic Oscillator) The script incorporates a Stochastic Oscillator to analyze the relative position of the current price compared to its price range over a recent period. It ensures that the momentum is moving in the correct direction (e.g., ensuring the main line is above the signal line for buys) to avoid entering a trade too early or during a weak transition.
4. Final Verification (MACD) As a final "gatekeeper," the script checks the Moving Average Convergence Divergence (MACD) Signal line. This acts as a final confirmation of the trend's health. A signal is only triggered if the MACD confirms that the overall market energy supports the direction indicated by the other three factors.
Visual Output
When all four of these conditions—Trend, Momentum, Stochastic position, and MACD confirmation—are met at the exact same time, the script places a visual marker (an arrow) on your chart.
- Upward Arrows: Indicate a potential "Buy" opportunity where all bullish filters have aligned.
- Downward Arrows: Indicate a potential "Sell" opportunity where all bearish filters have aligned.
By requiring four different mathematical conditions to be true simultaneously, the logic aims to filter out "market noise," highlighting only the moments where multiple technical perspectives agree on a price move.
//+------------------------------------------------------------------+
//| 10 Minute trader                                                 |
//+------------------------------------------------------------------+
#property copyright "Ron T"
#property link      "http://www.lightpatch.com"

#property indicator_chart_window
#property indicator_buffers 6
#property indicator_color1 White  // arrow up for moving average
#property indicator_color2 White  // arrow down for moving average
#property indicator_color3 Aqua   // box for stoch
#property indicator_color4 Red    // box for rsi
#property indicator_color5 White  // box for macd
#property indicator_color6 White  // dot for early stoch cross

//---- buffers
double ExtMapBuffer1[];
double ExtMapBuffer2[];
double ExtMapBuffer3[];
double ExtMapBuffer4[];
double ExtMapBuffer5[];
double ExtMapBuffer6[];


// User Input


//+------------------------------------------------------------------+
//| Custom indicator initialization function                         |
//|------------------------------------------------------------------|

int init()
  {

   // 233 up arrow
   // 234 down arrow
   // 159 big dot
   // 168 open square

   SetIndexStyle(0,DRAW_ARROW);
   SetIndexBuffer(0, ExtMapBuffer1);
   SetIndexArrow(0,233);  //up

   SetIndexStyle(1,DRAW_ARROW);
   SetIndexBuffer(1, ExtMapBuffer2);
   SetIndexArrow(1,234);  //down

   SetIndexStyle(2,DRAW_ARROW);
   SetIndexBuffer(2, ExtMapBuffer3);
   SetIndexArrow(2,168);  //open square

   SetIndexStyle(3,DRAW_ARROW);
   SetIndexBuffer(3, ExtMapBuffer4);
   SetIndexArrow(3,168);  //open square

   SetIndexStyle(4,DRAW_ARROW);
   SetIndexBuffer(4, ExtMapBuffer5);
   SetIndexArrow(4,168);  //open square

   SetIndexStyle(5,DRAW_ARROW);
   SetIndexBuffer(5, ExtMapBuffer6);
   SetIndexArrow(5,159);  //dot

   return(0);
  }


//+------------------------------------------------------------------+
//| Custor indicator deinitialization function                       |
//+------------------------------------------------------------------+
int deinit()
  {
   int i;

   for( i=0; i<Bars; i++ ) ExtMapBuffer1[i]=0;
   for( i=0; i<Bars; i++ ) ExtMapBuffer2[i]=0;
   for( i=0; i<Bars; i++ ) ExtMapBuffer3[i]=0;
   for( i=0; i<Bars; i++ ) ExtMapBuffer4[i]=0;
   for( i=0; i<Bars; i++ ) ExtMapBuffer5[i]=0;
   for( i=0; i<Bars; i++ ) ExtMapBuffer6[i]=0;

   return(0);
  }


//+------------------------------------------------------------------+
//| Custom indicator iteration function                              |
//+------------------------------------------------------------------+
int start()
  {
   double    wma=0,    wma_p=0;  // linear Weighted Moving Average & Previous
   double    sma=0,    sma_p=0;  // Simple Moving Average & Previous
   double stochm=0, stochm_p=0;  // STOCHastic Main & Previous
   double stochs=0, stochs_p=0;  // STOCHastic Signal
   double  macdm=0;              // Moving Average Convergance Divergance Main
   double  macds=0;              // Moving Average Convergance Divergance Signal
   double    rsi=0;              // Relative Strength Indicator
   double   rsi1=0,     rsi2=0;  // 1st 2 periods of past history
   double   rsi3=0,     rsi4=0;  // 2nd 2 periods

   int pos=Bars-100;             // leave room for moving average periods

   while(pos>=0)
     {

      wma_p=wma; // save previous calculations
      wma=iMA(Symbol(),0,10,0,MODE_LWMA,PRICE_CLOSE,pos);

      sma_p=sma; // save previous calculations
      sma=iMA(Symbol(),0,20,0,MODE_SMA,PRICE_CLOSE,pos);

      stochm_p=stochm;
      stochm=iStochastic(Symbol(),0,10,6,6,0,1,0,pos);
      stochs_p=stochs;
      stochs=iStochastic(Symbol(),0,10,6,6,0,1,1,pos);

      rsi=iRSI(Symbol(),0,28,PRICE_CLOSE,pos);
      rsi1=iRSI(Symbol(),0,28,PRICE_CLOSE,pos+1);
      rsi2=iRSI(Symbol(),0,28,PRICE_CLOSE,pos+2);
      rsi3=iRSI(Symbol(),0,28,PRICE_CLOSE,pos+3);
      rsi4=iRSI(Symbol(),0,28,PRICE_CLOSE,pos+4);

      macdm=iMACD(Symbol(),0,24,52,18,0,0,pos);
      macds=iMACD(Symbol(),0,24,52,18,0,1,pos);

      // RISING stochastic cross
      // if (stochm_p>stochm && stochs_p<stochs && stochs>stochm)

      // FALLING stochastic cross
      // if (stochm_p<stochm && stochs_p>stochs && stochs<stochm)


      if ( wma_p < sma_p && wma > sma )
        {
         if (rsi > 52 && ( rsi1<48 || rsi2<48 || rsi3<48 ) )   //blue
           {
            if (stochm > stochs)                               //red
              {
               if (macds > 0)                                  //white
                 {
                  ExtMapBuffer1[pos]=wma - 0.0011;
                 }
              }
           }
        }

      //if (rsi > 55 )   //white dot
      //  {
      //   ExtMapBuffer6[pos]=wma + 0.0013;
      //  }

      if ( wma_p > sma_p && wma < sma )
        {
         if (rsi < 48 && ( rsi1>52 || rsi2>52 || rsi3>52 ) )
           {
            if (stochm < stochs)
              {
               if (macds < 0)
                 {
                  ExtMapBuffer1[pos]=wma + 0.0011;
                 }
              }
           }
        }

 	   pos--;
     }

   return(0);
  }
//+------------------------------------------------------------------+
Comments