10Min_011_v1
Download script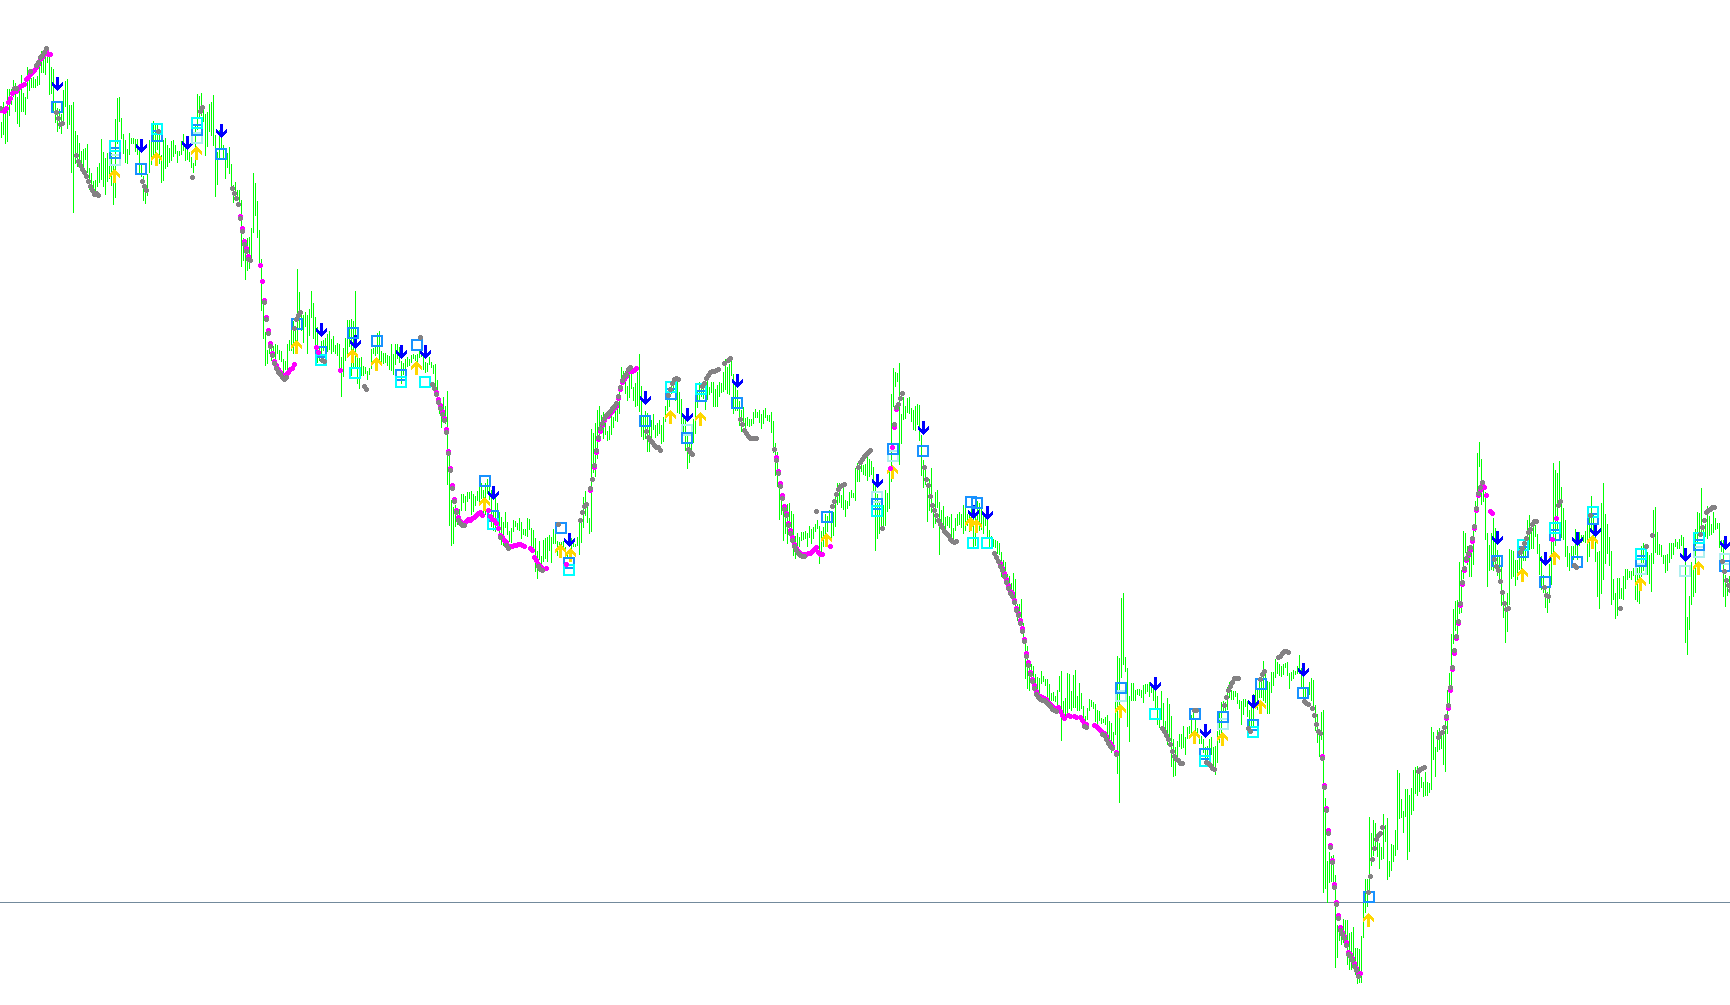
This technical script is designed as a specialized trading indicator that identifies potential market movements by analyzing multiple mathematical data points simultaneously. Instead of relying on a single metric, it combines four major technical indicators—Moving Averages, RSI (Relative Strength Index), Stochastics, and MACD—to provide a comprehensive view of market momentum and trend direction.
Core Logic and Analysis
The script functions by constantly scanning historical price data to calculate various "signals." It looks for specific relationships between these signals to determine whether the market is showing strength (bullish) or weakness (bearish).
1. Trend Identification (Moving Averages) The primary logic is based on a crossover between two different types of moving averages:
- Weighted Moving Average (WMA): Reacts more quickly to recent price changes.
- Simple Moving Average (SMA): Provides a smoother, broader view of the average price. When the fast-moving average crosses over the slower one, the script identifies a potential shift in trend direction.
2. Multi-Factor Confirmation To filter out "false" signals and increase accuracy, the script checks three additional conditions whenever a moving average crossover occurs:
- Momentum Check (RSI): It evaluates if the Relative Strength Index has moved significantly above or below specific thresholds, indicating if the current price move has enough "strength" to sustain itself.
- Overbought/Oversold Check (Stochastics): It compares the Stochastic Main and Signal lines to see if the market is currently in an extreme state (too high or too low).
- Trend Confirmation (MACD): It checks the MACD Signal line to verify if the overall momentum aligns with the direction of the crossover.
Visual Indicators on the Chart
The script translates these complex calculations into visual marks on your trading chart, allowing you to see the "logic" at a glance:
- Directional Arrows: These appear when the moving averages cross, indicating the primary trend shift.
- Squares/Markers: These appear only when a moving average crossover is accompanied by specific confirmations from the RSI, Stochastics, or MACD. They act as "high-confidence" signals because they require multiple indicators to agree.
- Dots: These serve as auxiliary markers, appearing when the RSI reaches high levels (indicating potential exhaustion) or when the Stochastic values hit extreme boundaries (overbought/oversold zones).
Summary of Operation
In short, this script acts as a multi-layered filter. It identifies a trend change first, then looks for "permission" from three other different mathematical tools before highlighting a significant signal on your screen. This reduces the noise of individual indicators by requiring a consensus between them.
/*-----------------------------+
|			       |
| Shared by www.Aptrafx.com    |
|			       |
+------------------------------*/

//+------------------------------------------------------------------+
//| 10 Minute trader                                                 |
//+------------------------------------------------------------------+
#property copyright "Ron T"
#property link      "http://www.lightpatch.com"

#property indicator_chart_window
#property indicator_buffers 7
#property indicator_color1 HotPink  // arrow up for moving average
#property indicator_color2 HotPink  // arrow down for moving average
#property indicator_color3 Aqua   // box for stoch
#property indicator_color4 Red    // box for rsi
#property indicator_color5 White  // box for macd
#property indicator_color6 White  // dot
#property indicator_color7 HotPink  // dot

//---- buffers
double ExtMapBuffer1[];
double ExtMapBuffer2[];
double ExtMapBuffer3[];
double ExtMapBuffer4[];
double ExtMapBuffer5[];
double ExtMapBuffer6[];
double ExtMapBuffer7[];


// User Input


//+------------------------------------------------------------------+
//| Custom indicator initialization function                         |
//|------------------------------------------------------------------|

int init()
  {

   // 233 up arrow
   // 234 down arrow
   // 159 big dot
   // 168 open square

   SetIndexStyle(0,DRAW_ARROW);
   SetIndexBuffer(0, ExtMapBuffer1);
   SetIndexArrow(0,233);  //up

   SetIndexStyle(1,DRAW_ARROW);
   SetIndexBuffer(1, ExtMapBuffer2);
   SetIndexArrow(1,234);  //down

   SetIndexStyle(2,DRAW_ARROW);
   SetIndexBuffer(2, ExtMapBuffer3);
   SetIndexArrow(2,168);  //open square

   SetIndexStyle(3,DRAW_ARROW);
   SetIndexBuffer(3, ExtMapBuffer4);
   SetIndexArrow(3,168);  //open square

   SetIndexStyle(4,DRAW_ARROW);
   SetIndexBuffer(4, ExtMapBuffer5);
   SetIndexArrow(4,168);  //open square

   SetIndexStyle(5,DRAW_ARROW);
   SetIndexBuffer(5, ExtMapBuffer6);
   SetIndexArrow(5,159);  //dot

   SetIndexStyle(6,DRAW_ARROW);
   SetIndexBuffer(6, ExtMapBuffer7);
   SetIndexArrow(6,159);  //dot

   return(0);
  }


//+------------------------------------------------------------------+
//| Custor indicator deinitialization function                       |
//+------------------------------------------------------------------+
int deinit()
  {
   int i;

   for( i=0; i<Bars; i++ ) ExtMapBuffer1[i]=0;
   for( i=0; i<Bars; i++ ) ExtMapBuffer2[i]=0;
   for( i=0; i<Bars; i++ ) ExtMapBuffer3[i]=0;
   for( i=0; i<Bars; i++ ) ExtMapBuffer4[i]=0;
   for( i=0; i<Bars; i++ ) ExtMapBuffer5[i]=0;
   for( i=0; i<Bars; i++ ) ExtMapBuffer6[i]=0;
   for( i=0; i<Bars; i++ ) ExtMapBuffer7[i]=0;

   return(0);
  }


//+------------------------------------------------------------------+
//| Custom indicator iteration function                              |
//+------------------------------------------------------------------+
int start()
  {
   double    wma=0,    wma_p=0;  // linear Weighted Moving Average & Previous
   double    sma=0,    sma_p=0;  // Simple Moving Average & Previous
   double stochm=0;              // STOCHastic Main
   double stochm1=0, stochm2=0;  // long chain stochm 1&2
   double stochm3=0, stochm4=0;  // long chain stochm 3&4
   double stochs=0;              // STOCHastic Signal
   double stochs1=0, stochs2=0;  // long chain stochs 1&2
   double stochs3=0, stochs4=0;  // long chain stochs 3&4
   double  macdm=0;              // Moving Average Convergance Divergance Main
   double  macds=0;              // Moving Average Convergance Divergance Signal
   double    rsi=0;              // Relative Strength Indicator
   double   rsi1=0,     rsi2=0;  // long chain rsi 1&2
   double   rsi3=0,     rsi4=0;  // long chain rsi 3&4

   int pos=Bars-100;             // leave room for moving average periods

   while(pos>=0)
     {

      wma_p=wma; // save previous calculations
      wma=iMA(Symbol(),0,10,0,MODE_LWMA,PRICE_CLOSE,pos);

      sma_p=sma; // save previous calculations
      sma=iMA(Symbol(),0,20,0,MODE_SMA,PRICE_CLOSE,pos);

      stochs=iStochastic(Symbol(),0,10,6,6,0,1,1,pos);
      stochs=iStochastic(Symbol(),0,10,6,6,0,1,1,pos+1);
      stochs=iStochastic(Symbol(),0,10,6,6,0,1,1,pos+2);
      stochs=iStochastic(Symbol(),0,10,6,6,0,1,1,pos+3);
      stochs=iStochastic(Symbol(),0,10,6,6,0,1,1,pos+4);

      stochm=iStochastic(Symbol(),0,10,6,6,0,1,0,pos);
      stochm1=iStochastic(Symbol(),0,10,6,6,0,1,0,pos+1);
      stochm2=iStochastic(Symbol(),0,10,6,6,0,1,0,pos+2);
      stochm3=iStochastic(Symbol(),0,10,6,6,0,1,0,pos+3);
      stochm4=iStochastic(Symbol(),0,10,6,6,0,1,0,pos+4);

      rsi=iRSI(Symbol(),0,28,PRICE_CLOSE,pos);
      rsi1=iRSI(Symbol(),0,28,PRICE_CLOSE,pos+1);
      rsi2=iRSI(Symbol(),0,28,PRICE_CLOSE,pos+2);
      rsi3=iRSI(Symbol(),0,28,PRICE_CLOSE,pos+3);
      rsi4=iRSI(Symbol(),0,28,PRICE_CLOSE,pos+4);

      macdm=iMACD(Symbol(),0,24,52,18,0,0,pos);
      macds=iMACD(Symbol(),0,24,52,18,0,1,pos);

      // RISING stochastic cross
      // if (stochm1>stochm && stochs1<stochs && stochs>stochm)

      // FALLING stochastic cross
      // if (stochm1<stochm && stochs1>stochs && stochs<stochm)


      if ( wma_p < sma_p && wma > sma )
        {
         ExtMapBuffer1[pos]=wma - 0.0003;

         if (rsi > 52 && ( rsi1<48 || rsi2<48 || rsi3<48 || rsi4<48 ) )   //blue
           {
            ExtMapBuffer3[pos]=wma + 0.0003;
           }
         if (stochm>stochs)                                               //red
           {
            ExtMapBuffer4[pos]=wma + 0.0006;
           }
         if (macds > 0)                                                   //white
           {
            ExtMapBuffer5[pos]=wma + 0.0009;
           }
        }

      if ( wma_p > sma_p && wma < sma )
        {
         ExtMapBuffer2[pos]=wma + 0.0003;

         if (rsi < 48 && ( rsi1>52 || rsi2>52 || rsi3>52 || rsi4>52 ) )
           {
            ExtMapBuffer3[pos]=wma - 0.0003;
           }
         if (stochm < stochs)
           {
            ExtMapBuffer4[pos]=wma - 0.0006;
           }
         if (macds < 0)
           {
            ExtMapBuffer5[pos]=wma - 0.0009;
           }
        }

      if (rsi > 60 )   //white dot
        {
         ExtMapBuffer6[pos]=wma + 0.0007;
        }
      if (stochm > 80)
        {
          ExtMapBuffer7[pos]=wma + 0.0008;
        }


      if (rsi < 40 )   //white dot
        {
         ExtMapBuffer6[pos]=wma - 0.0007;
        }
      if (stochm < 20)
        {
          ExtMapBuffer7[pos]=wma - 0.0008;
        }


 	   pos--;
     }

   return(0);
  }
//+------------------------------------------------------------------+
Comments