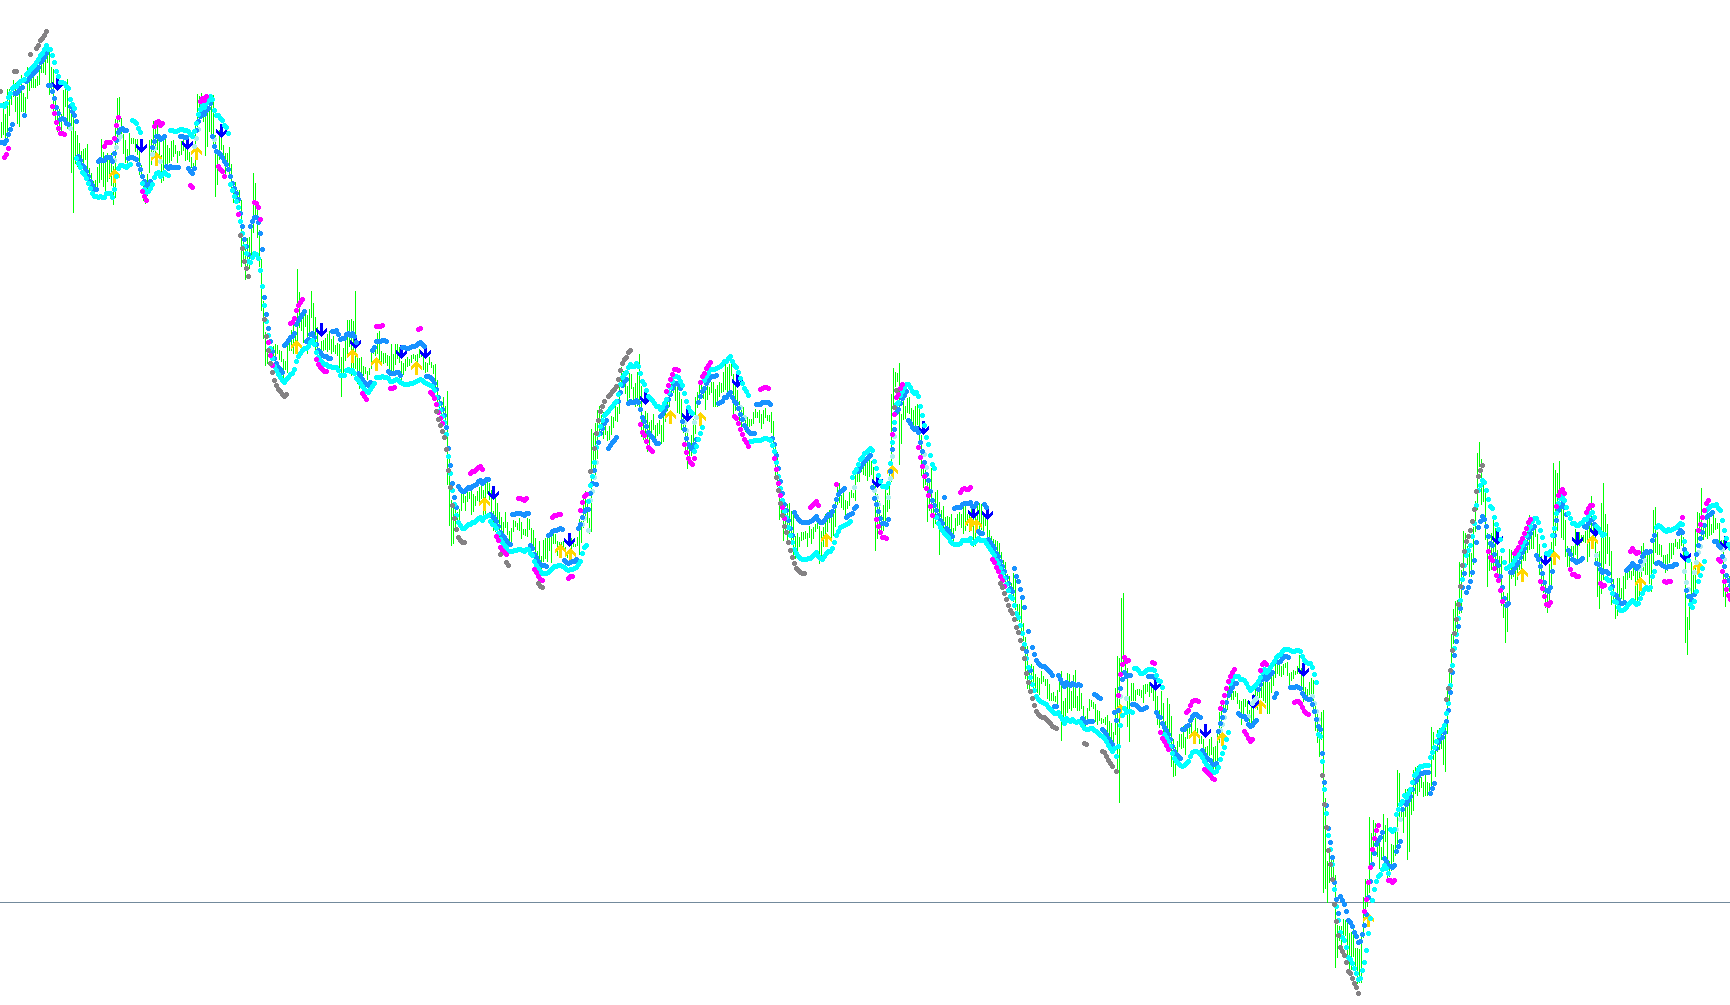
This script is a specialized technical analysis tool designed for the MetaTrader platform to help traders identify potential market trends and entry points by synthesizing multiple popular trading indicators into visual signals.
Core Logic Overview
Instead of relying on a single metric, this script simultaneously calculates five different types of market data: Moving Averages (WMA/SMA), Stochastic Oscillators, Relative Strength Index (RSI), and MACD. It processes these values across a historical timeline to detect specific "confluences"—moments where multiple technical conditions align to suggest a shift in momentum.
How it Works
The script scans the price history and looks for the following specific behaviors:
- Trend Crossings: It monitors when a fast-moving average (Weighted Moving Average) crosses over a slower-moving average (Simple Moving Average). This is a classic method for identifying shifts between bullish and bearish trends.
- Momentum & Overbought/Oversold Conditions: By utilizing the Stochastic and RSI indicators, the script identifies when an asset is gaining strength or becoming exhausted. It specifically looks for "crosses" in momentum (where one indicator moves above another) and significant price deviations.
- Strength Thresholds: The logic checks for specific numeric triggers, such as the RSI exceeding certain levels (indicating strong upward or downward pressure) or the gap between Stochastic values reaching a specific magnitude.
Visual Signals on the Chart
The script translates these complex mathematical calculations into easy-to-read visual markers on your trading chart:
- Directional Arrows: These appear when the moving averages cross, signaling a potential primary trend change.
- Trend Indicators (Dots/Squares): Various symbols are placed on the chart based on the RSI and Stochastic readings. For example, if the price shows significant strength compared to its recent history, a specific marker is triggered.
- Momentum Gauges: High-intensity signals (such as the "HotPink" markers) appear when the difference between momentum values exceeds a high threshold, suggesting a very strong directional push.
- Extreme Zones: The script also looks for "extreme" conditions—where both price strength and momentum are at the very edges of their typical range—and marks these with specific dots to alert you of potential exhaustion points.
Summary for the User
Essentially, this tool acts as a filter. It watches the "noise" of the market and only places a visual mark on your chart when several different technical conditions agree that a move is happening. It combines trend-following (Moving Averages) with momentum-tracking (Stochastic/RSI) to give you a multi-layered view of market activity at a glance.
//+------------------------------------------------------------------+
//| 10 Minute trader                                                 |
//+------------------------------------------------------------------+
#property copyright "Ron T"
#property link      "http://www.lightpatch.com"

#property indicator_chart_window
#property indicator_buffers 7
#property indicator_color1 HotPink  // arrow up
#property indicator_color2 HotPink  // arrow down
#property indicator_color3 Aqua
#property indicator_color4 Red
#property indicator_color5 White
#property indicator_color6 HotPink
#property indicator_color7 LimeGreen

//---- buffers
double ExtMapBuffer1[];
double ExtMapBuffer2[];
double ExtMapBuffer3[];
double ExtMapBuffer4[];
double ExtMapBuffer5[];
double ExtMapBuffer6[];
double ExtMapBuffer7[];


// User Input


//+------------------------------------------------------------------+
//| Custom indicator initialization function                         |
//|------------------------------------------------------------------|

int init()
  {

   // 233 up arrow
   // 234 down arrow
   // 159 big dot
   // 168 open square

   SetIndexStyle(0,DRAW_ARROW);
   SetIndexBuffer(0, ExtMapBuffer1);
   SetIndexArrow(0,233);  //up

   SetIndexStyle(1,DRAW_ARROW);
   SetIndexBuffer(1, ExtMapBuffer2);
   SetIndexArrow(1,234);  //down

   SetIndexStyle(2,DRAW_ARROW);
   SetIndexBuffer(2, ExtMapBuffer3);
   SetIndexArrow(2,159);

   SetIndexStyle(3,DRAW_ARROW);
   SetIndexBuffer(3, ExtMapBuffer4);
   SetIndexArrow(3,159);

   SetIndexStyle(4,DRAW_ARROW);
   SetIndexBuffer(4, ExtMapBuffer5);
   SetIndexArrow(4,159);

   SetIndexStyle(5,DRAW_ARROW);
   SetIndexBuffer(5, ExtMapBuffer6);
   SetIndexArrow(5,159);

   SetIndexStyle(6,DRAW_ARROW);
   SetIndexBuffer(6, ExtMapBuffer7);
   SetIndexArrow(6,159);

   return(0);
  }


//+------------------------------------------------------------------+
//| Custor indicator deinitialization function                       |
//+------------------------------------------------------------------+
int deinit()
  {
   int i;

   for( i=0; i<Bars; i++ ) ExtMapBuffer1[i]=0;
   for( i=0; i<Bars; i++ ) ExtMapBuffer2[i]=0;
   for( i=0; i<Bars; i++ ) ExtMapBuffer3[i]=0;
   for( i=0; i<Bars; i++ ) ExtMapBuffer4[i]=0;
   for( i=0; i<Bars; i++ ) ExtMapBuffer5[i]=0;
   for( i=0; i<Bars; i++ ) ExtMapBuffer6[i]=0;
   for( i=0; i<Bars; i++ ) ExtMapBuffer7[i]=0;

   return(0);
  }


//+------------------------------------------------------------------+
//| Custom indicator iteration function                              |
//+------------------------------------------------------------------+
int start()
  {
   double    wma=0,    wma_p=0;  // linear Weighted Moving Average & Previous
   double    sma=0,    sma_p=0;  // Simple Moving Average & Previous
   double stochm=0;              // STOCHastic Main
   double stochm1=0, stochm2=0;  // long chain stochm 1&2
   double stochm3=0, stochm4=0;  // long chain stochm 3&4
   double stochs=0;              // STOCHastic Signal
   double stochs1=0, stochs2=0;  // long chain stochs 1&2
   double stochs3=0, stochs4=0;  // long chain stochs 3&4
   double  macdm=0;              // Moving Average Convergance Divergance Main
   double  macds=0;              // Moving Average Convergance Divergance Signal
   double    rsi=0;              // Relative Strength Indicator
   double   rsi1=0,     rsi2=0;  // long chain rsi 1&2
   double   rsi3=0,     rsi4=0;  // long chain rsi 3&4

   int pos=Bars-100;             // leave room for moving average periods

   while(pos>=0)
     {

      wma_p=wma; // save previous calculations
      wma=iMA(Symbol(),0,10,0,MODE_LWMA,PRICE_CLOSE,pos);

      sma_p=sma; // save previous calculations
      sma=iMA(Symbol(),0,20,0,MODE_SMA,PRICE_CLOSE,pos);

      stochs=iStochastic(Symbol(),0,10,6,6,0,1,1,pos);
      stochs=iStochastic(Symbol(),0,10,6,6,0,1,1,pos+1);
      stochs=iStochastic(Symbol(),0,10,6,6,0,1,1,pos+2);
      stochs=iStochastic(Symbol(),0,10,6,6,0,1,1,pos+3);
      stochs=iStochastic(Symbol(),0,10,6,6,0,1,1,pos+4);

      stochm=iStochastic(Symbol(),0,10,6,6,0,1,0,pos);
      stochm1=iStochastic(Symbol(),0,10,6,6,0,1,0,pos+1);
      stochm2=iStochastic(Symbol(),0,10,6,6,0,1,0,pos+2);
      stochm3=iStochastic(Symbol(),0,10,6,6,0,1,0,pos+3);
      stochm4=iStochastic(Symbol(),0,10,6,6,0,1,0,pos+4);

      rsi=iRSI(Symbol(),0,28,PRICE_CLOSE,pos);
      rsi1=iRSI(Symbol(),0,28,PRICE_CLOSE,pos+1);
      rsi2=iRSI(Symbol(),0,28,PRICE_CLOSE,pos+2);
      rsi3=iRSI(Symbol(),0,28,PRICE_CLOSE,pos+3);
      rsi4=iRSI(Symbol(),0,28,PRICE_CLOSE,pos+4);

      macdm=iMACD(Symbol(),0,12,26,9,0,0,pos);
      macds=iMACD(Symbol(),0,12,26,9,0,1,pos);

      // RISING stochastic cross
      // if (stochm1>stochm && stochs1<stochs && stochs>stochm)

      // FALLING stochastic cross
      // if (stochm1<stochm && stochs1>stochs && stochs<stochm)


      if ( wma_p < sma_p && wma > sma )                                // MA crossed up
        {
         ExtMapBuffer1[pos]=wma - 0.0003;
        }
      if (rsi > 52 && ( rsi1<48 || rsi2<48 || rsi3<48 || rsi4<48 ) )   //blue
        {
         ExtMapBuffer3[pos]=wma + 0.0003;
        }
      if (stochm>stochs)                                               //red
        {
         ExtMapBuffer4[pos]=wma + 0.0006;
        }
      if (macds > 0)                                                   //white
        {
         ExtMapBuffer5[pos]=wma + 0.0009;
        }
      if (stochm-stochs>30)                                            //hotpink
        {
         ExtMapBuffer6[pos]=wma + 0.0012;
        }


      if ( wma_p > sma_p && wma < sma )
        {
         ExtMapBuffer2[pos]=wma + 0.0003;
        }
      if (rsi < 48 && ( rsi1>52 || rsi2>52 || rsi3>52 || rsi4>52 ) )
        {
         ExtMapBuffer3[pos]=wma - 0.0003;
        }
      if (stochm < stochs)
        {
         ExtMapBuffer4[pos]=wma - 0.0006;
        }
      if (macds < 0)
        {
         ExtMapBuffer5[pos]=wma - 0.0009;
        }
      if (stochm-stochs<-30)                                            //hotpink
        {
         ExtMapBuffer6[pos]=wma - 0.0012;
        }

      if ( rsi>60 && stochm>80 )
        {
          ExtMapBuffer7[pos]=wma + 0.0015;
        }

      if ( rsi<40 && stochm<20 )   //white dot
        {
          ExtMapBuffer7[pos]=wma - 0.0015;
        }

 	   pos--;
     }

   return(0);
  }
//+------------------------------------------------------------------+
Comments