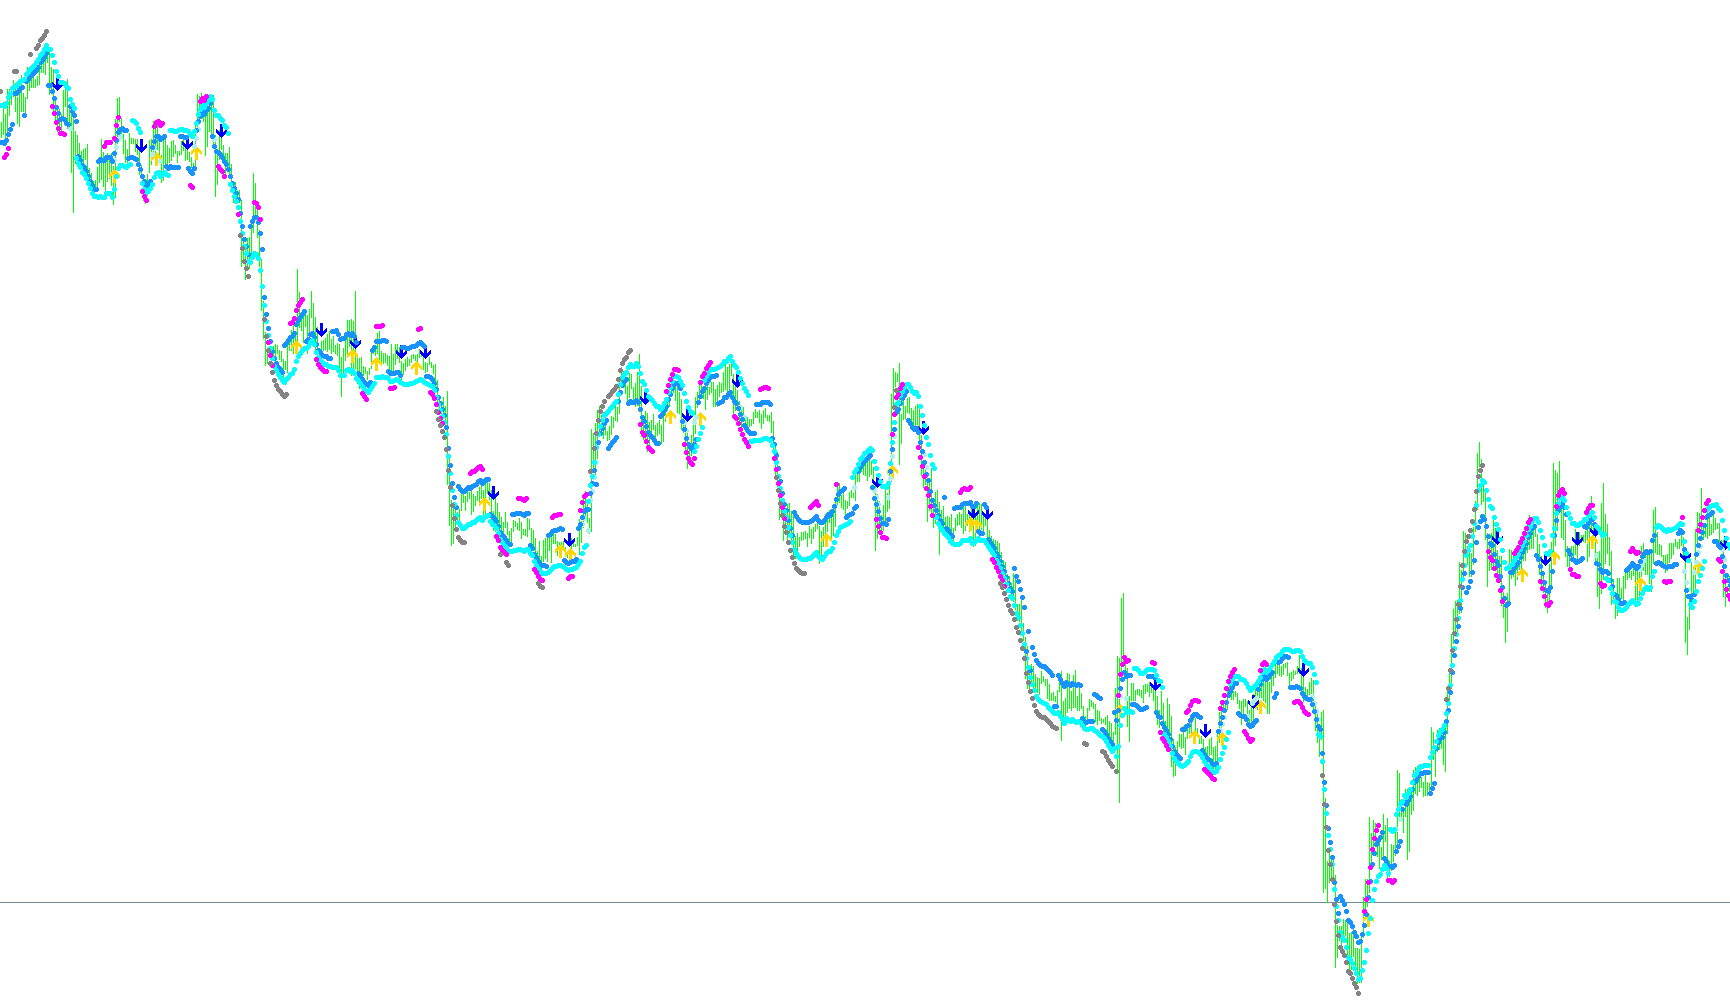
The 10 Minute Trader is a specialized technical analysis tool designed to identify potential market entry points by monitoring multiple financial indicators simultaneously. Rather than relying on a single metric, the script analyzes various types of price action—including momentum, trend, and overbought/oversold conditions—to provide visual cues directly on your trading chart.
How the Logic Works
The script works by constantly scanning historical and current price data to calculate several different "signals." When specific mathematical conditions are met across these indicators, the tool places a visual marker (an arrow) on the chart to notify the trader of a potential move.
Here is a breakdown of the logic used to generate these signals:
1. Trend Identification (Moving Averages) The script tracks two different types of moving averages: a Weighted Moving Average (WMA) and a Simple Moving Average (SMA).
- Buy Signal: It looks for instances where the faster-moving average crosses above the slower one, suggesting an upward shift in momentum.
- Sell Signal: It identifies when the faster average drops below the slower one, suggesting a downward shift.
2. Momentum and Strength (RSI & Stochastic) The script uses the Relative Strength Index (RSI) and the Stochastic Oscillator to determine if the market is becoming overextended or moving with significant strength.
- Price Reversal Logic: It monitors "chains" of previous data points for the RSI to detect sharp turns in sentiment (e.g., identifying a move into positive territory after a period of weakness).
- Overbought/Oversold Conditions: The Stochastic Oscillator is used to find specific gaps between momentum and signal lines. If the gap is wide enough (exceeding a specific threshold), it triggers a signal, highlighting high-intensity momentum.
3. Trend Confirmation (MACD) The Moving Average Convergence Divergence (MACD) is used as a secondary confirmation layer. The script checks the position of the "Signal Line" relative to the zero mark to determine if the broader market trend is currently bullish or bearish.
4. Confluence Zones Finally, the script looks for "Confluence"—moments where multiple indicators agree at once. For example, it will trigger a specific high-priority signal if both the RSI and the Stochastic Oscillator reach extreme levels simultaneously (such as both being extremely high or extremely low), suggesting a very strong trend or a significant potential exhaustion point.
Summary of Visual Output
- Upward Arrows: Represent various "Buy" conditions ranging from basic trend crossovers to high-momentum confirmations.
- Downward Arrows: Represent various "Sell" conditions based on the same logic applied to bearish price action.
- Dynamic Positioning: The signals are plotted at slight offsets above or below the moving average line to ensure they remain clear and visible on your chart without cluttering the price candles.
//+------------------------------------------------------------------+
//| 10 Minute trader                                                 |
//+------------------------------------------------------------------+
#property copyright "Ron T"
#property link      "http://www.lightpatch.com"
//----
#property indicator_chart_window
#property indicator_buffers 7
#property indicator_color1 HotPink  // arrow up
#property indicator_color2 HotPink  // arrow down
#property indicator_color3 Aqua
#property indicator_color4 Red
#property indicator_color5 White
#property indicator_color6 HotPink
#property indicator_color7 LimeGreen
//---- buffers
double ExtMapBuffer1[];
double ExtMapBuffer2[];
double ExtMapBuffer3[];
double ExtMapBuffer4[];
double ExtMapBuffer5[];
double ExtMapBuffer6[];
double ExtMapBuffer7[];
// User Input
//+------------------------------------------------------------------+
//| Custom indicator initialization function                         |
//|------------------------------------------------------------------|
int init()
  {
   SetIndexStyle(0,DRAW_ARROW);
   SetIndexBuffer(0, ExtMapBuffer1);
   SetIndexArrow(0,233);  //up
   SetIndexStyle(1,DRAW_ARROW);
   SetIndexBuffer(1, ExtMapBuffer2);
   SetIndexArrow(1,234);  //down
   SetIndexStyle(2,DRAW_ARROW);
   SetIndexBuffer(2, ExtMapBuffer3);
   SetIndexArrow(2,159);
   SetIndexStyle(3,DRAW_ARROW);
   SetIndexBuffer(3, ExtMapBuffer4);
   SetIndexArrow(3,159);
   SetIndexStyle(4,DRAW_ARROW);
   SetIndexBuffer(4, ExtMapBuffer5);
   SetIndexArrow(4,159);
   SetIndexStyle(5,DRAW_ARROW);
   SetIndexBuffer(5, ExtMapBuffer6);
   SetIndexArrow(5,159);
   SetIndexStyle(6,DRAW_ARROW);
   SetIndexBuffer(6, ExtMapBuffer7);
   SetIndexArrow(6,159);
   return(0);
  }
//+------------------------------------------------------------------+
//| Custor indicator deinitialization function                       |
//+------------------------------------------------------------------+
int deinit()
  {
   int i;
   for( i=0; i<Bars; i++)ExtMapBuffer1[i]=0;
   for( i=0; i<Bars; i++)ExtMapBuffer2[i]=0;
   for( i=0; i<Bars; i++)ExtMapBuffer3[i]=0;
   for( i=0; i<Bars; i++)ExtMapBuffer4[i]=0;
   for( i=0; i<Bars; i++)ExtMapBuffer5[i]=0;
   for( i=0; i<Bars; i++)ExtMapBuffer6[i]=0;
   for( i=0; i<Bars; i++)ExtMapBuffer7[i]=0;
   return(0);
  }
//+------------------------------------------------------------------+
//| Custom indicator iteration function                              |
//+------------------------------------------------------------------+
int start()
  {
   double    wma=0,    wma_p=0;  // linear Weighted Moving Average & Previous
   double    sma=0,    sma_p=0;  // Simple Moving Average & Previous
   double stochm=0;              // STOCHastic Main
   double stochm1=0, stochm2=0;  // long chain stochm 1&2
   double stochm3=0, stochm4=0;  // long chain stochm 3&4
   double stochs=0;              // STOCHastic Signal
   double stochs1=0, stochs2=0;  // long chain stochs 1&2
   double stochs3=0, stochs4=0;  // long chain stochs 3&4
   double  macdm=0;              // Moving Average Convergance Divergance Main
   double  macds=0;              // Moving Average Convergance Divergance Signal
   double    rsi=0;              // Relative Strength Indicator
   double   rsi1=0,     rsi2=0;  // long chain rsi 1&2
   double   rsi3=0,     rsi4=0;  // long chain rsi 3&4
//-----
   int pos=Bars-100;             // leave room for moving average periods
//-----
   while(pos>=0)
     {
      wma_p=wma; // save previous calculations
      wma=iMA(Symbol(),0,10,0,MODE_LWMA,PRICE_CLOSE,pos);
      sma_p=sma; // save previous calculations
      sma=iMA(Symbol(),0,20,0,MODE_SMA,PRICE_CLOSE,pos);
      //----
      stochs=iStochastic(Symbol(),0,10,6,6,0,1,1,pos);
      stochs=iStochastic(Symbol(),0,10,6,6,0,1,1,pos+1);
      stochs=iStochastic(Symbol(),0,10,6,6,0,1,1,pos+2);
      stochs=iStochastic(Symbol(),0,10,6,6,0,1,1,pos+3);
      stochs=iStochastic(Symbol(),0,10,6,6,0,1,1,pos+4);
      stochm=iStochastic(Symbol(),0,10,6,6,0,1,0,pos);
      stochm1=iStochastic(Symbol(),0,10,6,6,0,1,0,pos+1);
      stochm2=iStochastic(Symbol(),0,10,6,6,0,1,0,pos+2);
      stochm3=iStochastic(Symbol(),0,10,6,6,0,1,0,pos+3);
      stochm4=iStochastic(Symbol(),0,10,6,6,0,1,0,pos+4);
      //----
      rsi=iRSI(Symbol(),0,28,PRICE_CLOSE,pos);
      rsi1=iRSI(Symbol(),0,28,PRICE_CLOSE,pos+1);
      rsi2=iRSI(Symbol(),0,28,PRICE_CLOSE,pos+2);
      rsi3=iRSI(Symbol(),0,28,PRICE_CLOSE,pos+3);
      rsi4=iRSI(Symbol(),0,28,PRICE_CLOSE,pos+4);
      //----
      macdm=iMACD(Symbol(),0,12,26,9,0,0,pos);
      macds=iMACD(Symbol(),0,12,26,9,0,1,pos);
      if(wma_p < sma_p && wma > sma)                               // MA crossed up
        {
         ExtMapBuffer1[pos]=wma - 0.0003;
        }
      if (rsi > 52 &&(rsi1<48 || rsi2<48 || rsi3<48 || rsi4<48))   //blue
        {
         ExtMapBuffer3[pos]=wma + 0.0003;
        }
      if (stochm>stochs)                                               //red
        {
         ExtMapBuffer4[pos]=wma + 0.0006;
        }
      if (macds > 0)                                                   //white
        {
         ExtMapBuffer5[pos]=wma + 0.0009;
        }
      if (stochm-stochs>30)                                            //hotpink
        {
         ExtMapBuffer6[pos]=wma + 0.0012;
        }
      if(wma_p > sma_p && wma < sma )
        {
         ExtMapBuffer2[pos]=wma + 0.0003;
        }
      if (rsi < 48 &&(rsi1>52 || rsi2>52 || rsi3>52 || rsi4>52))
        {
         ExtMapBuffer3[pos]=wma - 0.0003;
        }
      if (stochm < stochs)
        {
         ExtMapBuffer4[pos]=wma - 0.0006;
        }
      if (macds < 0)
        {
         ExtMapBuffer5[pos]=wma - 0.0009;
        }
      if (stochm-stochs<-30)                                            //hotpink
        {
         ExtMapBuffer6[pos]=wma - 0.0012;
        }
      if(rsi>60 && stochm>80 )
        {
         ExtMapBuffer7[pos]=wma + 0.0015;
        }
      if(rsi<40 && stochm<20)  //white dot
        {
         ExtMapBuffer7[pos]=wma - 0.0015;
        }
      pos--;
     }
   return(0);
  }
//+------------------------------------------------------------------+
Comments