candlestrength
Download script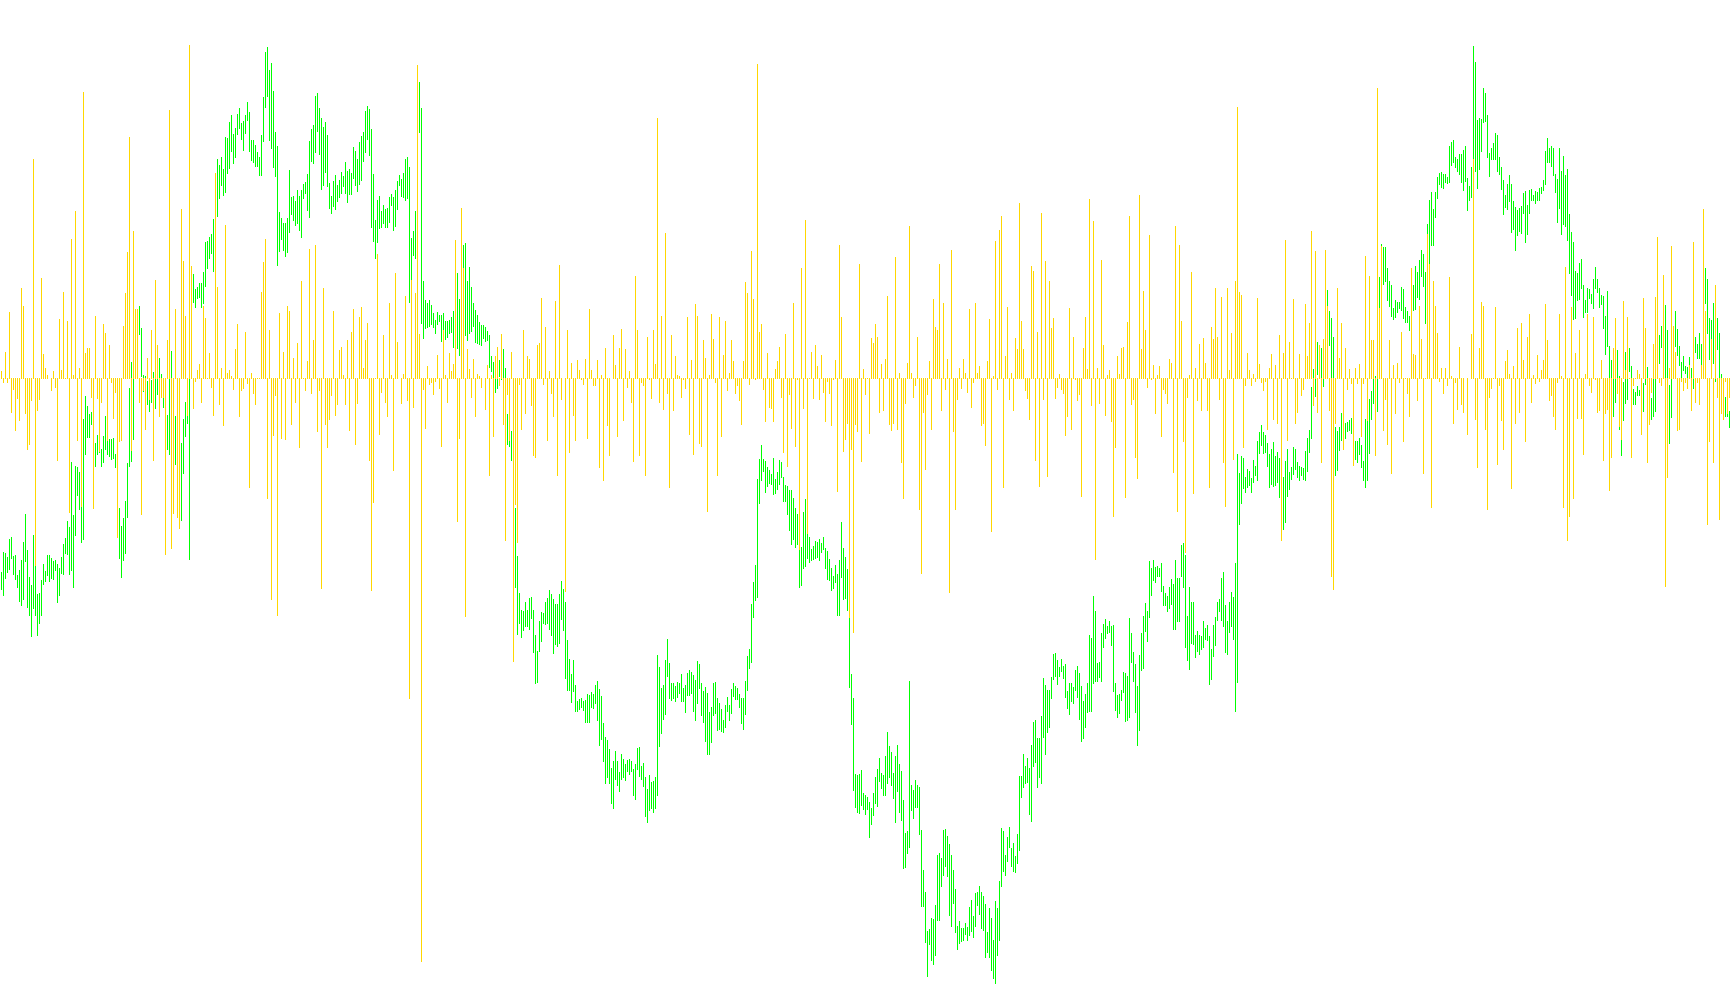
This tool is designed to provide traders with a clear visual representation of price movement intensity by measuring the "body" of each candle on a trading chart. Instead of focusing on the total range (from the highest peak to the lowest valley), this script isolates the actual price action that occurred between the opening and closing of a period.
How it Works
The logic follows a straightforward process to convert raw price data into a measurable value:
- Price Difference Calculation: For every candle on the chart, the tool calculates the distance between the opening price and the closing price. This identifies the "meat" of the candle, excluding any wicks or shadows that might represent temporary volatility without actual sustained movement.
- Standardization (Pip Conversion): To ensure that the data is readable across different types of assets (such as various currency pairs or commodities), the script automatically detects the decimal precision of your broker. It then converts the raw price difference into "Pips." This allows you to see a consistent measurement regardless of whether an asset moves in small fractions or larger units.
- Visual Representation: The resulting data is displayed in a separate window below your main chart as a histogram. Each bar represents the magnitude of the move for that specific timeframe.
Key Benefits for Traders
By using this logic, you can quickly distinguish between high-momentum moves and periods of consolidation:
- Identifying Strength: Large bars indicate significant price movement from open to close, suggesting strong buying or selling pressure.
- Filtering Noise: Because it ignores the wicks (the highs and lows outside the body), it helps you see how much "real" progress was made during a period, filtering out deceptive price spikes that didn't result in a sustained move.
- Consistency: The automatic pip calculation ensures that the scale remains relevant across different instruments, making it easier to compare the volatility of one pair against another at a glance.
Miscellaneous
9
Views
0
Downloads
0
Favorites
candlestrength
//+------------------------------------------------------------------+
//|                                                   CandleStrength |
//|                                       Copyright 2016, Il Anokhin |
//|                           http://www.mql5.com/en/users/ilanokhin |
//+------------------------------------------------------------------+
#property copyright "Copyright © 2016, Il Anokhin"
#property link "http://www.mql5.com/en/users/ilanokhin"
#property description ""
#property strict
//-------------------------------------------------------------------------
// Indicator settings
//-------------------------------------------------------------------------
#property  indicator_separate_window
#property  indicator_buffers 1
#property  indicator_color1 Blue
#property  indicator_width1 4
//-------------------------------------------------------------------------
// Variables
//-------------------------------------------------------------------------
double c[],pip;
//-------------------------------------------------------------------------
// 1. Initialization
//-------------------------------------------------------------------------
int OnInit(void)
  {

   IndicatorBuffers(1);

   SetIndexStyle(0,DRAW_HISTOGRAM);

   SetIndexBuffer(0,c);

   Comment("Copyright © 2016, Il Anokhin");

   return(INIT_SUCCEEDED);

  }
//-------------------------------------------------------------------------
// 2. Deinitialization
//-------------------------------------------------------------------------
int deinit() {return(0);}
//-------------------------------------------------------------------------
// 3. Main function
//-------------------------------------------------------------------------
int OnCalculate(const int rates_total,
                const int prev_calculated,
                const datetime &time[],
                const double &open[],
                const double &high[],
                const double &low[],
                const double &close[],
                const long &tick_volume[],
                const long &volume[],
                const int &spread[])
  {

   int i,lim,cb;

   if(Bars<10) return(0);

   cb=IndicatorCounted();

   lim=Bars-cb;

   if(cb==0) lim=lim-11;

   if(cb>0) lim++;

//--- 3.1. Define pip -----------------------------------------------------

   if(Digits==4 || Digits<=2) pip=Point;

   if(Digits==5 || Digits==3) pip=Point*10;

//--- 3.2. Main loop ------------------------------------------------------

   for(i=lim;i>0;i--)
     {

      c[i]=(Close[i]-Open[i])/pip;

     }

//--- 3.3. End of main function -------------------------------------------

   return(rates_total);

  }

//-------------------------------------------------------------------------
Comments