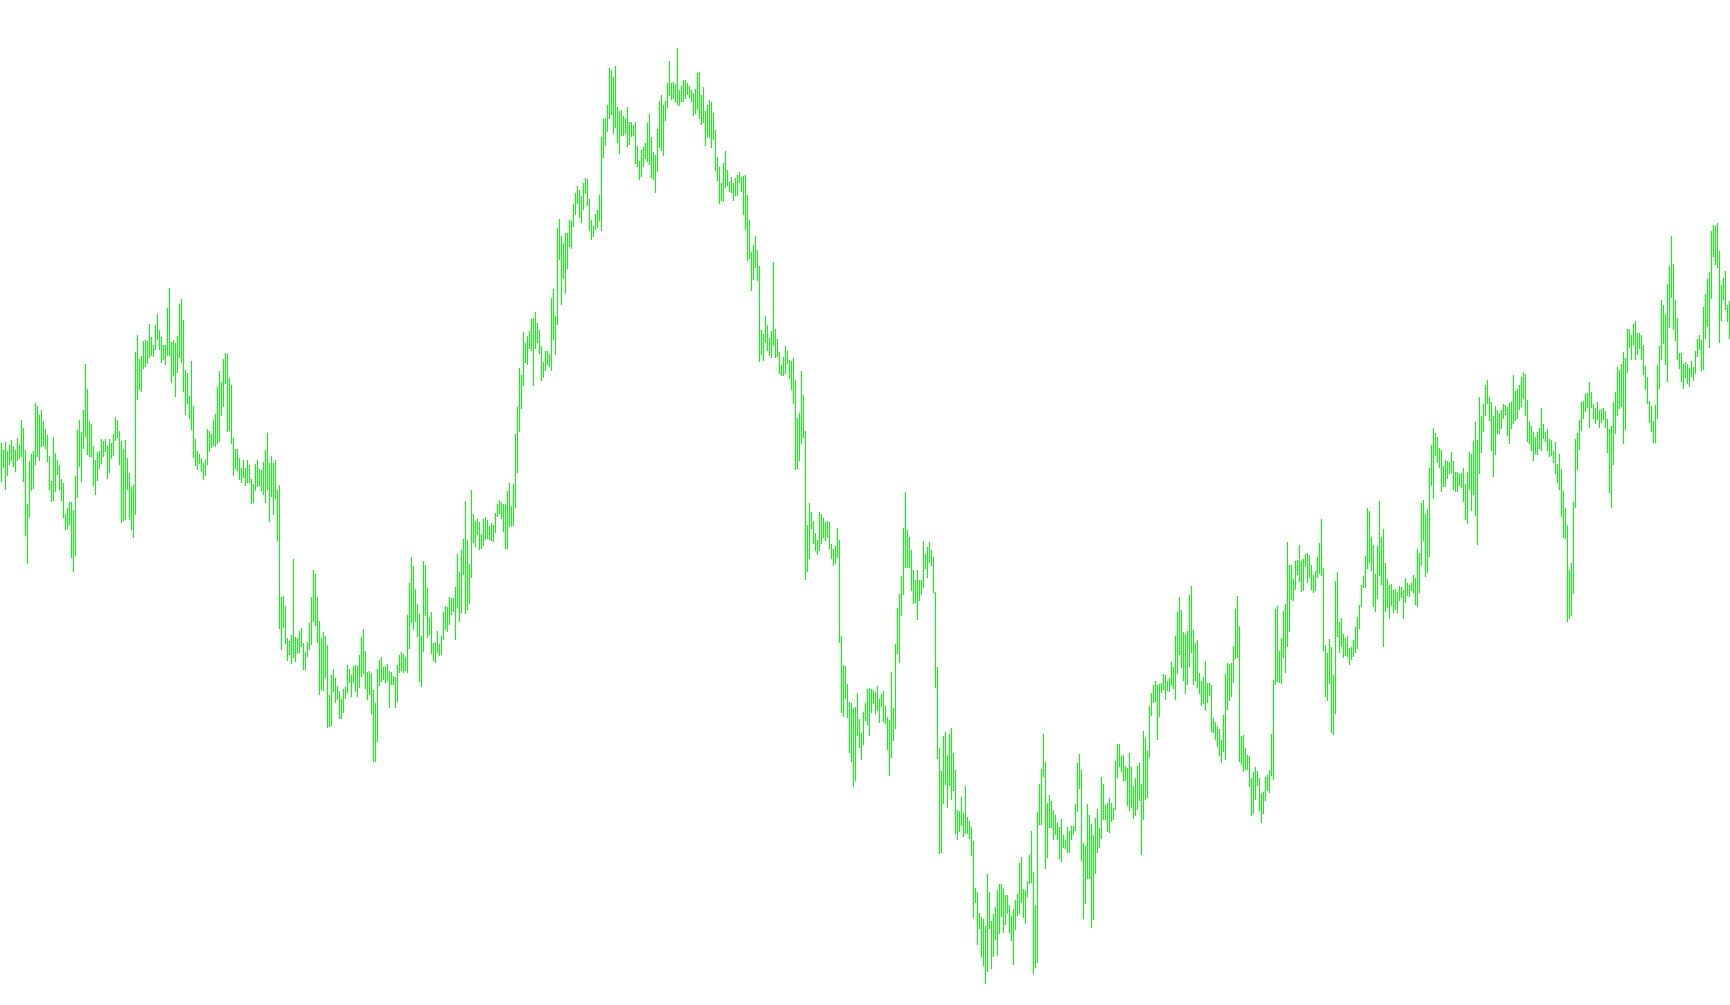
The BearsBullsImpuls indicator is designed to provide a visual representation of market momentum by comparing current price action against a specific moving average baseline. Its primary goal is to identify the strength and direction of market trends, helping traders distinguish between "bullish" (upward) and "bearish" (downward) pressure in real-time.
Core Logic and Methodology
The indicator operates through a three-step calculation process:
1. Establishing the Baseline The script first calculates a Moving Average based on user-defined parameters (such as the timeframe period, the type of moving average, and the specific price point used). This serves as the "anchor" or equilibrium line for the market.
2. Measuring Market Extremes Once the baseline is established, the indicator looks at two specific price points for every candle:
- The Bullish Reach: It calculates the distance between the high of the candle and the moving average.
- The Bearish Reach: It calculates the distance between the low of the candle and the moving average.
3. Momentum Synthesis The indicator then combines these two distances to determine the "net sentiment." By adding the bullish reach and the bearish reach together, it calculates a net value.
- If the combined value is positive (greater than or equal to zero), it suggests that the upward price action is dominating the current movement.
- If the combined value is negative, it suggests that downward pressure is prevailing.
Visual Output
The results of this calculation are plotted in a separate window below the main trading chart. Rather than showing complex numbers, the indicator translates these calculations into two distinct lines:
- Green Line: Represents bullish momentum (positive sentiment).
- Red Line: Represents bearish momentum (negative sentiment).
By observing where these lines switch and how they behave relative to each other, users can get a clearer picture of whether the market's immediate "impulse" is leaning toward the buyers or the sellers.
//+------------------------------------------------------------------+
//|                                          BearsBullsImpuls-2b.mq4 |
//|                           Copyright © 2012, basisforex@gmail.com |
//+------------------------------------------------------------------+
#property copyright "Copyright © 2012, basisforex@gmail.com"
#property link      "basisforex@gmail.com"
//----------------------------------------
#property indicator_separate_window
#property indicator_buffers 2
#property indicator_color1 Green
#property indicator_color2 Red
//----
extern int maPeriod = 13;
extern int maMODE   = 3;//  0=MODE_SMA; 1=MODE_EMA; 2=MODE_SMMA; 3=MODE_LWMA.
extern int maPRICE  = 5;//  0=PRICE_CLOSE; 1=PRICE_OPEN; 2=PRICE_HIGH; 3=PRICE_LOW; 4=PRICE_MEDIAN; 5=PRICE_TYPICAL; 6=PRICE_WEIGHTED.
//----
double Buffer1[];
double Buffer2[];
//+------------------------------------------------------------------+
int init()
 {
   SetIndexBuffer(0, Buffer1);
   SetIndexStyle(0, DRAW_LINE, 0, 2);
   //----
   SetIndexBuffer(1, Buffer2);
   SetIndexStyle(1, DRAW_LINE, 0, 2);
   //----
   IndicatorShortName("BearsBullsImpuls (" + maPeriod + ") ");
   return(0);
 }
//+------------------------------------------------------------------+
int start()
 {
   double Bears ,Bulls , ma, avg;
   int i, limit;
   int counted_bars = IndicatorCounted();
   if(counted_bars < 0) return(-1);
   if(counted_bars > 0) counted_bars--;
   limit = Bars - counted_bars;
   for(i = 0; i < limit; i++)
    {
       ma = iMA(NULL, 0, maPeriod, 0, maMODE, maPRICE, i);
       Bulls = High[i] - ma;
       Bears = Low[i] - ma;
       avg = Bears + Bulls;
       if(avg >= 0)
        {
           Buffer1[i] = 1.0;
           Buffer2[i] = -1.0;
        }
       else
        {
           Buffer1[i] = -1.0;
           Buffer2[i] = 1.0;
        }
    }
   return(0);
 }
//+------------------------------------------------------------------+
Comments