Candles_Ratio_v1
Download script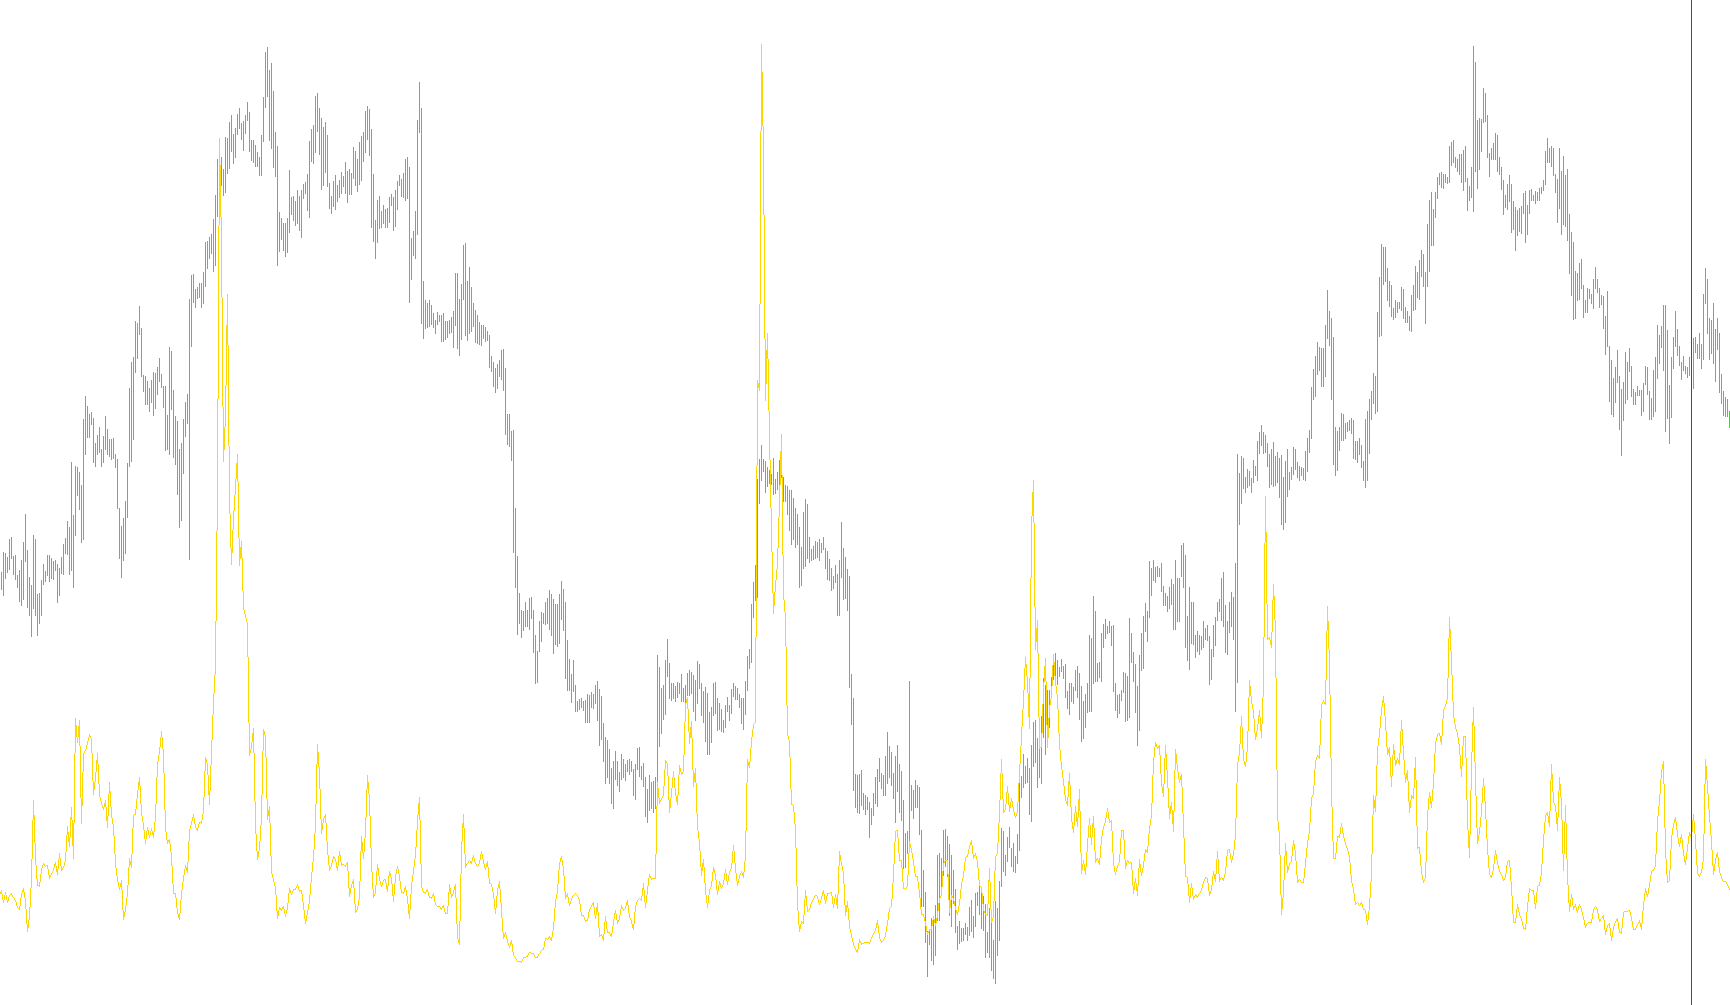
This tool is designed to help traders visualize the balance of power between buying and selling pressure over a specific period. Rather than looking at simple price movement, it analyzes the physical "size" of the candles on your chart to determine market sentiment.
How the Logic Works
The script operates by examining a rolling window of recent price bars (defaulting to the last 20 periods). For every bar within this timeframe, it performs the following logic:
- Identifying Bullish Strength: It looks for "green" candles (where the closing price is higher than the opening price). It calculates the height of these candles and adds them together to create a total sum of buying momentum.
- Identifying Bearish Strength: It looks for "red" candles (where the closing price is lower than the opening price). It calculates the height of these candles and adds them together to create a total sum of selling pressure.
- Calculating the Ratio: Finally, the tool divides the total buying momentum by the total selling pressure.
What the Results Mean
The result is displayed as a line in a separate window below your main chart. This value represents a ratio:
- A Value Greater than 1: Indicates that the "buying" volume (the height of upward candles) outweighs the "selling" volume within that period. This suggests bullish dominance.
- A Value Less than 1: Indicates that the "selling" volume is stronger than the buying volume, suggesting bearish dominance.
- The Trend Line: As the ratio moves up or down, it provides a smoothed visual representation of whether the market's intensity is shifting from buyers to sellers or vice versa.
To help with visual reference, the script also places a vertical green line on your chart at a specific point in the past (based on your chosen period), allowing you to see where the current calculations began relative to historical price action.
//+------------------------------------------------------------------+
//|                                                Candles_Ratio.mq4 |
//|                               Copyright © 2010, Vladimir Hlystov |
//|                                         http://cmillion.narod.ru |
//+------------------------------------------------------------------+
#property copyright "Copyright © 2010, Vladimir Hlystov"
#property link      "WWW: http://cmillion.narod.ru  MAIL: cmillion@narod.ru"

#property indicator_separate_window
#property indicator_buffers    1
#property indicator_color1     Green
//+------------------------------------------------------------------+
extern int PeriodCN = 20;
double K[];
//+------------------------------------------------------------------+
int init()
  {
   SetIndexStyle(0,DRAW_LINE);
   SetIndexBuffer(0,K);
   return(0);
  }
//+------------------------------------------------------------------+
int start()
  {
   int limit=Bars-IndicatorCounted();
   ObjectDelete("startline");
   ObjectCreate("startline",OBJ_VLINE,0, Time[PeriodCN],0,0,0,0,0);
   ObjectSet   ("startline", OBJPROP_COLOR, Green);
   for(int n=0; n<limit; n++)
   {
      double B=0,M=0;
      for (int j = n; j<PeriodCN+n; j++)
      {
         if (Open[j]<Close[j]) B += Close[j]-Open[j];
         else                  M += Open[j]-Close[j];
      }
      K[n] = B / M;
   }
   return(0);
  }
//+------------------------------------------------------------------+
Comments