33_M3
Download script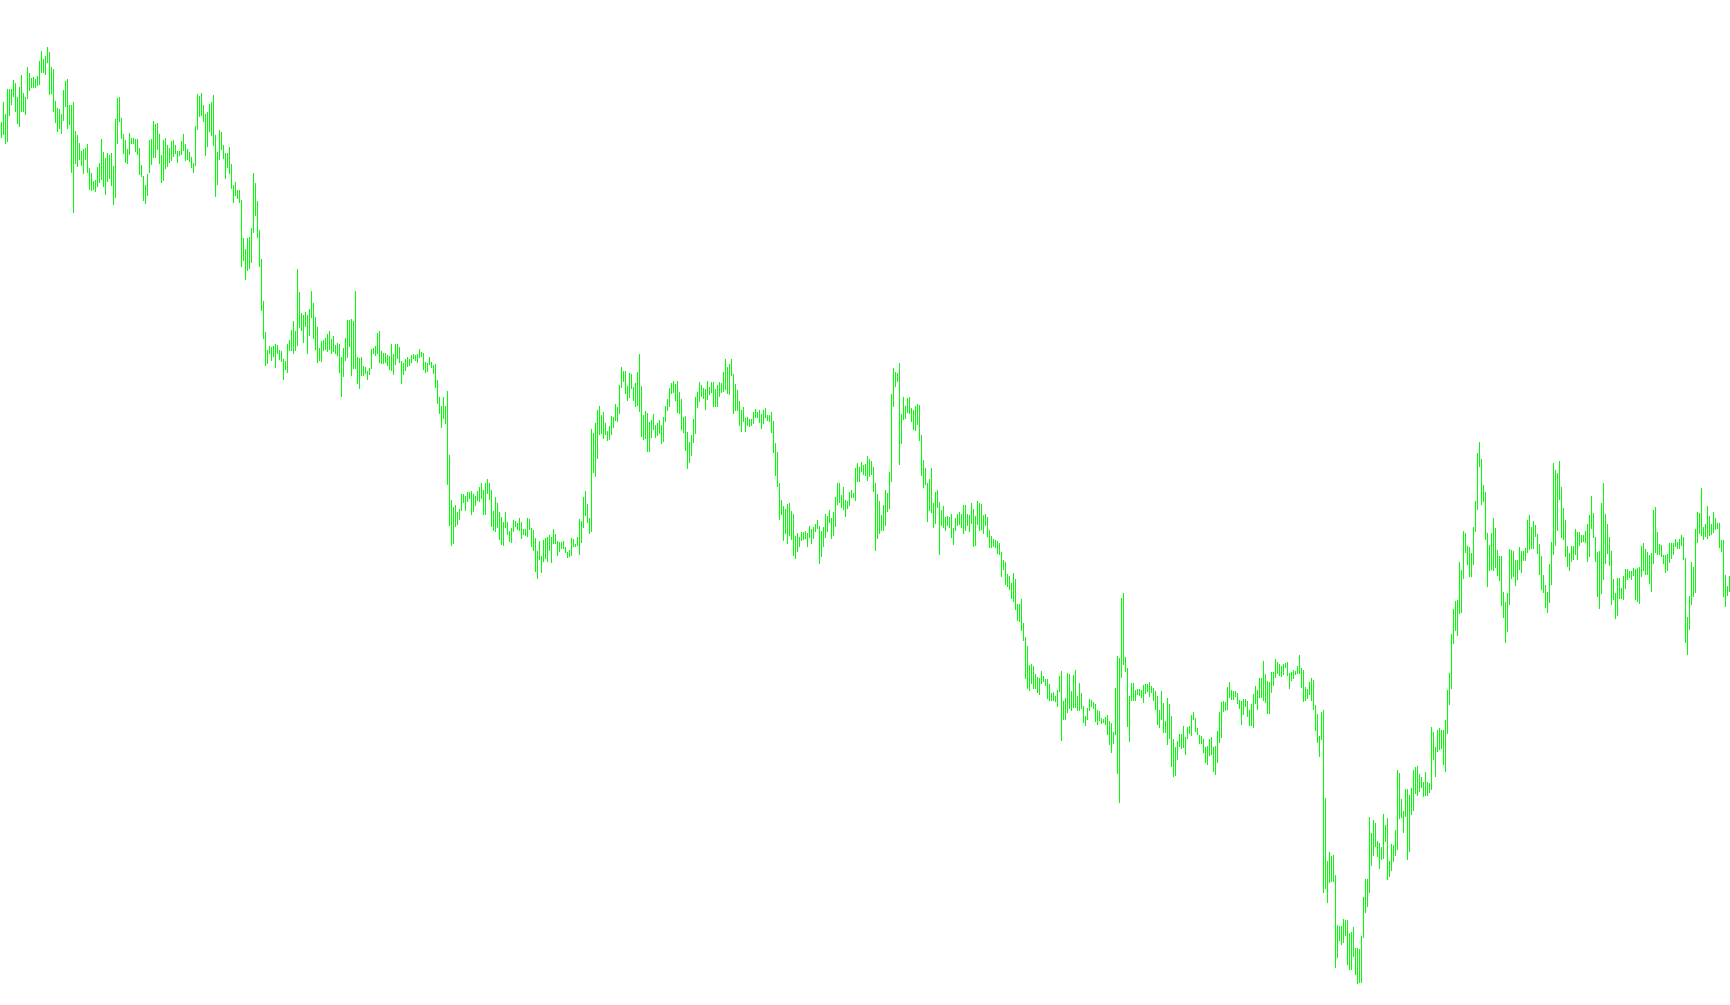
This script is a custom technical analysis tool designed for the MetaTrader trading platform. Its primary purpose is to visualize market momentum and volatility trends through a visual histogram, helping traders identify shifts in price direction and strength.
How the Logic Works
The tool functions by analyzing historical price data to calculate two distinct sets of signals, which are then displayed side-by-side in a separate window on your chart. Here is the step-by-step breakdown of its logic:
1. Data Processing and Smoothing The script begins by looking at a specific number of past bars (defaulting to 500) and focuses on a "Momentum" calculation. Momentum measures how quickly price changes over a set period. To prevent the data from being too "jittery" or noisy, the script applies a series of mathematical filters. It essentially takes the raw momentum and smooths it out multiple times, creating a refined view of the trend.
2. Dual-Track Calculation The core logic creates two parallel tracks of information:
- Primary Track: Monitors the current active momentum.
- Secondary Track: Processes a comparative version of that same momentum.
By running these calculations simultaneously, the tool can compare how the "current" market sentiment stacks up against a secondary baseline.
3. The Comparison Mechanism The script performs a specific mathematical transformation on both tracks to normalize the values. It then compares the two results:
- If the primary track shows stronger movement than the secondary track, it is recorded as one signal (represented in Lime Green).
- If the secondary track shows more significant movement or strength, it is recorded as a different signal (represented in Orange).
4. Visual Output The final result is a dual-colored histogram. Instead of just showing you a single line moving up and down, this tool shows you which "side" of the momentum trend is currently dominant.
Summary for Traders
In plain terms, this script acts as a visual "tug-of-war" indicator. It filters out market noise to show you which underlying force is winning: the immediate price momentum or a smoothed comparative trend. By watching the colors shift between Lime Green and Orange, traders can get a clearer picture of whether the current market push has enough strength to sustain itself or if it is losing steam compared to recent history.
//+------------------------------------------------------------------+
//|                                                        33_M3.mq4 |
//|                      Copyright © 2006, MetaQuotes Software Corp. |
//|                                        http://www.metaquotes.net |
//+------------------------------------------------------------------+
#property copyright "Copyright © 2006, MetaQuotes Software Corp."
#property link      "http://www.metaquotes.net"

#property indicator_separate_window
#property indicator_buffers 2
#property indicator_color1 LimeGreen
#property indicator_color2 Orange

extern int CountBars=500;
extern int t3_period=14;
extern int mom=10;

double buf1[];
double buf2[];

double value1=0;
int AccountedBars=0,numBars=0;
double value2=0;
double t3=0,t30=0,X1=0,X10=0,e10=0,e20=0,e30=0,e40=0,e50=0,e60=0;
double e1=0,e2=0,e3=0,e4=0,e5=0,e6=0,c1=0,c2=0,c3=0,c4=0;
double n=0,w1=0,w2=0,b=0,b2=0,b3=0;

//+------------------------------------------------------------------+
//| Custom indicator initialization function                         |
//+------------------------------------------------------------------+
int init()
  {
//---- indicators
   SetIndexStyle(0,DRAW_HISTOGRAM);
   SetIndexBuffer(0,buf1);
   SetIndexStyle(1,DRAW_HISTOGRAM);
   SetIndexBuffer(1,buf2);
//----
   return(0);
  }
//+------------------------------------------------------------------+
//| Custom indicator deinitialization function                       |
//+------------------------------------------------------------------+
int deinit()
  {
//----

//----
   return(0);
  }
//+------------------------------------------------------------------+
//| Custom indicator iteration function                              |
//+------------------------------------------------------------------+
int start()
  {
   int shift,cnt;
//----
b=0.7;
b2=b*b;
b3=b2*b;
c1=-b3;
c2=(3*(b2+b3));
c3=-3*(2*b2+b+b3);
c4=(1+3*b+b3+3*b2);
n=t3_period;

if(n<1) n=1;
n = 1 + 0.5*(n-1);
w1 = 2 / (n + 1);
w2 = 1 - w1;

if(AccountedBars==0) AccountedBars = Bars-CountBars;

for(cnt=AccountedBars;cnt<Bars;cnt++)
{
   shift = Bars - 1 - cnt;

   buf1[shift]=0;

   e1 = w1*iMomentum(Symbol(),0,mom,PRICE_CLOSE,shift) + w2*e1; e10 = w1*iMomentum(Symbol(),0,mom,PRICE_CLOSE,(shift+1)) + w2*e10;
   e2 = w1*e1 + w2*e2; e20 = w1*e10 + w2*e20;
   e3 = w1*e2 + w2*e3; e30 = w1*e20 + w2*e30;
   e4 = w1*e3 + w2*e4; e40 = w1*e30 + w2*e40;
   e5 = w1*e4 + w2*e5; e50 = w1*e40 + w2*e50;
   e6 = w1*e5 + w2*e6; e60 = w1*e50 + w2*e60;

   t3 = c1*e6 + c2*e5 + c3*e4 + c4*e3;
   t30 = c1*e60 + c2*e50 + c3*e40 + c4*e30;
   X1 = (t3-100)*100;
   X10 = (t30-100)*100;

   if(X1>X10) buf1[shift]=X1;
   if(X1<X10) buf2[shift]=X10;
   AccountedBars=AccountedBars+1;

}

//----
   return(0);
  }
//+------------------------------------------------------------------+
Comments