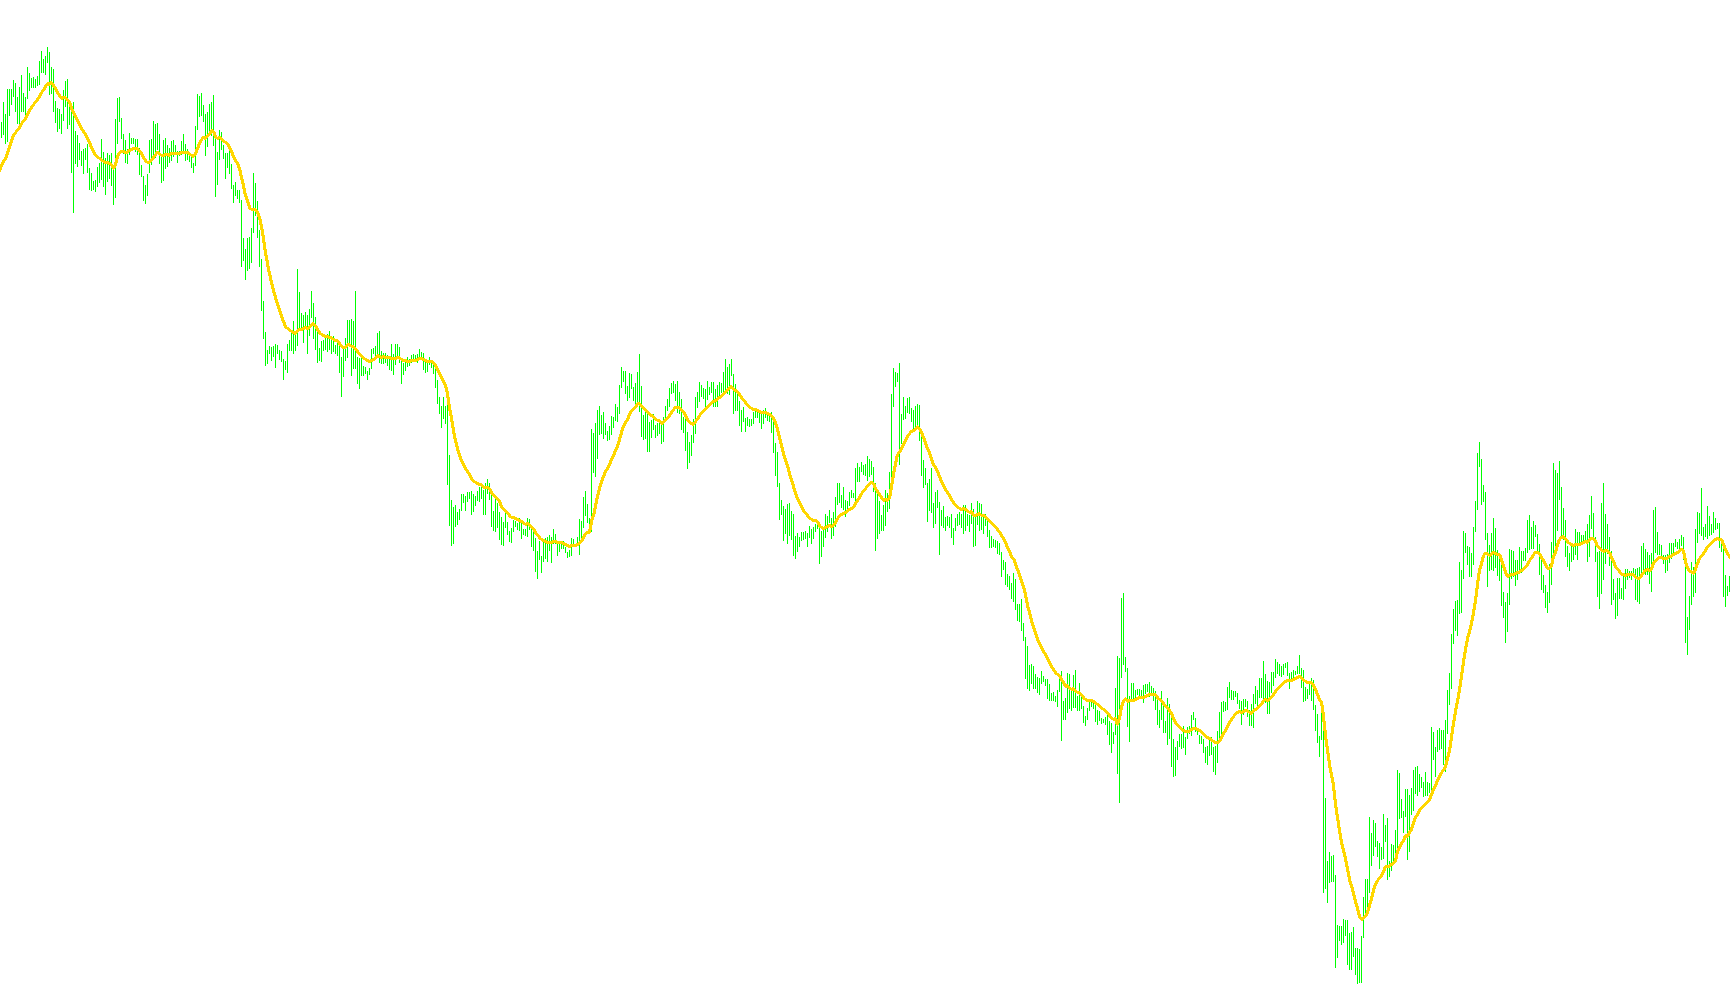
This script is designed to generate a specialized visual trend line on a trading chart, known as the 2p-IdealMA. Unlike standard moving averages that simply calculate an average price over a fixed number of past bars (which often results in significant "lag" or delay), this tool uses a more sophisticated mathematical approach to follow price movements more fluidly.
Core Logic Overview
The primary goal of this indicator is to create a smooth, responsive line that adapts to the current speed and direction of the market. It achieves this through three main logical steps:
1. Dynamic Price Analysis Instead of looking at a large block of history, the script focuses on the immediate relationship between the most recent price points. It calculates the difference between the current price and the previous price to determine the "momentum" of the movement.
2. Adaptive Smoothing The script employs a unique mathematical formula that factors in three specific elements:
- Current Price: Where the market is right now.
- Previous Position: Where the indicator was previously located.
- Momentum Weighting: How fast or slow the price is currently moving.
By combining these, the indicator can adjust its curve dynamically. If the price moves sharply, the formula allows the line to react more quickly; if the price is stable, the line remains smoother. This balances the need for a "clean" visual trend with the need for the indicator to stay close to the actual market data.
3. Sequential Calculation The script processes the chart chronologically. It uses the result of one calculation as an input for the next. This means each point on the blue line is inextricably linked to the point before it, ensuring a continuous, unbroken flow that mimics organic price movement rather than a jagged, disconnected set of data points.
Key Features for the User
- Reduced Lag: Because it prioritizes current momentum and previous values over a massive historical average, the line tends to stay closer to the "live" price action.
- Visual Clarity: The resulting output is a solid blue line that helps traders identify the underlying trend of an asset while filtering out minor market noise.
- Adjustable Sensitivity: Through the provided weights (
w1andw2), users can fine-tune how aggressively the indicator reacts to new price changes versus how much it favors smoothness.
// 22.01.2009 Ðåäàêòèðîâàë Íèêîëàé Êîñèöèí
//+X================================================================X+
//|                                    Moving Average 2p-IdealMA.mq4 |
//|                                      Copyright © 2009,   Neutron |                                                                   |
//+X================================================================X+
//---- îòðèñîâêà èíäèêàòîðà â îñíîâíîì îêíå
#property indicator_chart_window
//---- êîëè÷åñòâî èíäèêàòîðíûõ áóôåðîâ
#property  indicator_buffers 1
//---- öâåò ëèíèèè èíäèêàòîðîâ
#property indicator_color1 Blue
//---- âõîäíûå ïàðàìåòðû ýêñïåðòà
extern double w1 =0.1;
extern double w2 = 0.1;
//---- èíäèêàòîðíûå áóôåðû
double MA[];
//----
int StartBar;
//+X================================================================X+
//|  2p-IdealMA function                                             |
//+X================================================================X+
double GetIdealMASmooth(double W1_, double W2_,
                       double Series1, double Series0, double Resalt1)
 {
//---+
   double Resalt0, dSeries, dSeries2;
   dSeries = Series0 - Series1;
   dSeries2 = dSeries * dSeries -1.0;

   Resalt0 = (W1_ * (Series0 - Resalt1) +
                   Resalt1 + W2_ * Resalt1 * dSeries2)
                                           / (1.0 + W2_ * dSeries2);
   return(Resalt0);
//---+
 }
//+X================================================================X+
//|  initialization function                                         |
//+X================================================================X+
int init()
 {
//---+
   //---- ñòèëü èçîáðàæåíèÿ èíäèêàòîðà
   SetIndexStyle(0, DRAW_LINE, STYLE_SOLID, 3);
   //---- áóôåð äëÿ ïåðâîé ëèíèè èíäèêàòîðà
   SetIndexBuffer(0, MA);
   //---- ìèíèìàëüíîå êîëè÷åñòâî áàðîâ äëÿ ðàñ÷¸òà
   StartBar = 2;
   //----
   return(0);
//---+
 }
//+X================================================================X+
//|  start function                                                  |
//+X================================================================X+
int start()
 {
//---+
   //---- ïðîâåðêà êîëè÷åñòâà áàðîâ
                           //íà äîñòàòî÷íîñòü äëÿ äàëüíåéøåãî ðàñ÷¸òà
   if (Bars - 1 < StartBar)
                       return(-1);
   //---- Ââåäåíèå öåëûõ ïåðåìåííûõ è ïîëó÷åíèå óæå ïîñ÷èòàííûõ áàðîâ
   int MaxBar, limit, bar, counted_bars = IndicatorCounted();
   //---- ïðîâåðêà íà âîçìîæíûå îøèáêè
   if (counted_bars < 0)
                  return(-1);
   //---- ïîñëåäíèé ïîñ÷èòàííûé áàð äîëæåí áûòü ïåðåñ÷èòàí
   if (counted_bars > 0)
              counted_bars--;
   //---- îïðåäåëåíèå íîìåðà ñàìîãî ñòàðîãî áàðà,
            //íà÷èíàÿ ñ êîòîðîãî áóäåò ïðîèçåä¸í ïåðåñ÷¸ò âñåõ áàðîâ
   MaxBar = Bars - 2;
   //---- îïðåäåëåíèå íîìåðà ñàìîãî ñòàðîãî áàðà,
            //íà÷èíàÿ ñ êîòîðîãî áóäåò ïðîèçåä¸í ïåðåñ÷¸ò íîâûõ áàðîâ
   limit = Bars - counted_bars - 1;
   //---- èíèöèàëèçàöèÿ íóëÿ
   if (limit >= MaxBar)
     {
      limit = MaxBar;
      MA[MaxBar] = Close[MaxBar];
	   MA[MaxBar + 1] = Close[MaxBar + 1];
     }
   //---- ÂÛ×ÈÑËÅÍÈÅ ÈÍÄÈÊÀÒÎÐÀ
	for( bar = limit; bar >= 0; bar--)
      MA[bar] = GetIdealMASmooth(w1, w2,
                            Close[bar + 1], Close[bar], MA[bar + 1]);
   //----
   return(0);
//---+
 }
//+X----------------------------------------------------------------X+
Comments