3end_v1
Download script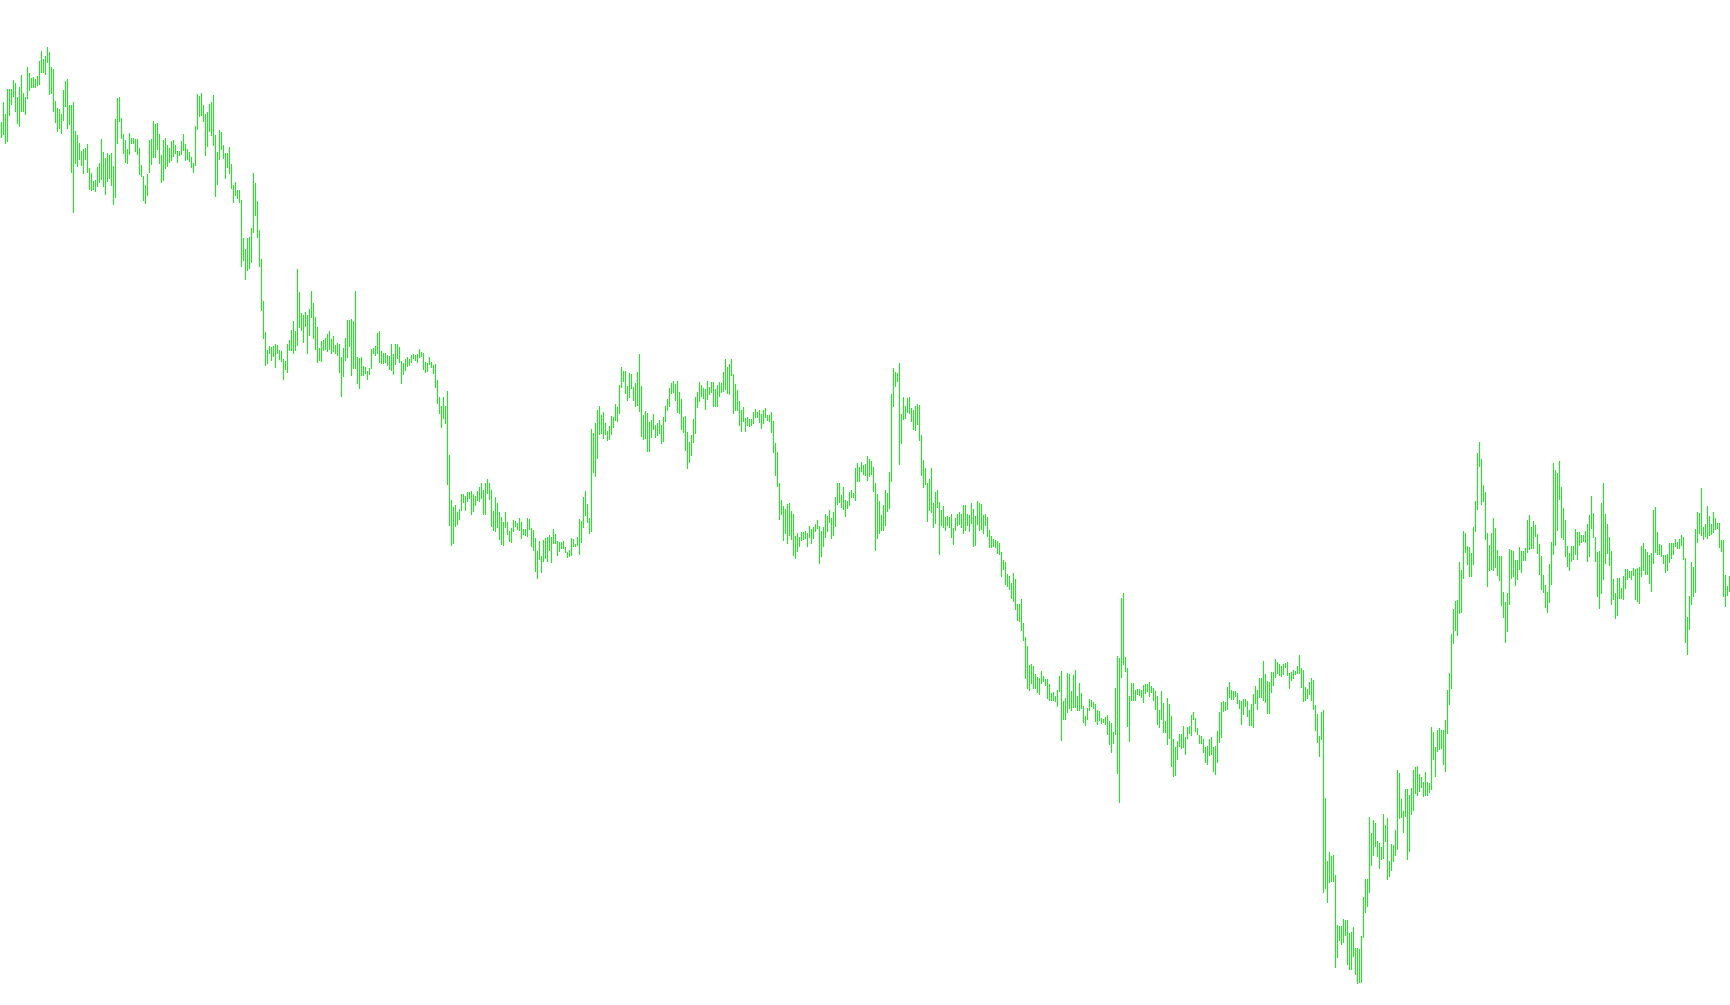
This tool is a specialized financial analysis indicator designed to provide traders with an enhanced perspective on price movement by calculating a synthetic "average" value derived from three different currency pairs. Instead of looking at a single asset in isolation, this script identifies a core relationship between a primary cross-pair and two supporting base pairs.
Core Concept
The logic operates by performing a mathematical correlation between three specific currency pairs (which you can define in the settings). By blending the closing prices of these assets, the indicator attempts to filter out market noise and reveal a more generalized trend. It essentially creates a "weighted composite" value that helps identify where the current price sits in relation to a calculated broader market sentiment.
How it Works
- Multi-Pair Integration: The script takes the closing prices of three different pairs (e.g., GBPUSD, USDCHF, and a cross-pair like GBPCHF).
- Synthetic Calculation: It performs a series of mathematical operations on these prices to generate three distinct values ($P1$, $P2$, and $P3$). These values represent different perspectives of how the three currencies are interacting with one another.
- Averaging Mechanism: The indicator then calculates the average of these three synthetic values to produce a single, smoothed line. This represents the "equilibrium" or "composite trend" for your chart.
- Visual Feedback:
- The Trend Line: A solid line is plotted to show this calculated composite value.
- Price Comparison: The script also tracks the current price of the asset you are viewing on your screen.
- Dynamic Signaling: The tool places visual markers (dots) on the chart based on where the current price sits in relation to the composite trend:
- If the price is above the calculated average, it marks a specific state.
- If the price is below the calculated average, it marks another.
Key Features for the User
- Customizable Pairs: You can choose which three currency pairs the logic should monitor to determine the composite trend.
- Trend Inversion: There is an option to flip the indicator horizontally across the axis, allowing you to view the relationship in reverse if your trading strategy requires it.
- Historical Depth: You can specify how many bars of historical data the indicator should process to ensure the chart remains clean and relevant to your current timeframe.
In summary, this script acts as a "filter" that translates complex inter-currency relationships into a single visual line, helping you see whether the current price is behaving normally relative to a broader group of related assets.
//+------------------------------------------------------------------+
//|                                                    3perekosa.mq4 |
//+------------------------------------------------------------------+
#property copyright "Ïîðó÷èê & aka KimIV"
#property link      "http://www.kimiv.ru"
//----
#property indicator_separate_window
#property indicator_buffers 4
#property indicator_color1 Aqua
#property indicator_color2 Yellow
#property indicator_color3 Green
#property indicator_color4 Red
//------- Ãëîáàëüíûå ïåðåìåííûå --------------------------------------
//------- Âíåøíèå ïàðàìåòðû èíäèêàòîðà -------------------------------
extern string NameCross   ="GBPCHF"; // Íàèìåíîâàíèå êðîññà
extern string NameMain1   ="GBPUSD"; // Íàèìåíîâàíèå îñíîâíîé ïàðû 1
extern string NameMain2   ="USDCHF"; // Íàèìåíîâàíèå îñíîâíîé ïàðû 2
extern int    NumberOfBars=1000;     // Êîëè÷åñòâî áàðîâ îáñ÷¸òà (0-âñå)
extern bool   Perevorot   =false;    // Ïåðåâîðà÷èâàåò èíäþêà îòíîñèòåëüíî ãîðèçîíòàëüíîé îñè.
//------- Áóôåðû èíäèêàòîðà ------------------------------------------
double buf0[], buf1[], buf2[], buf3[];
double C=0,P=0,P1=0,P2=0,P3=0;

//+------------------------------------------------------------------+
//| Custom indicator initialization function                         |
//+------------------------------------------------------------------+
  void init()
  {
   SetIndexBuffer(0, buf0);
   SetIndexLabel (0, "P");
   SetIndexStyle (0, DRAW_LINE, STYLE_SOLID, 1);
   SetIndexEmptyValue(0, 0);
   SetIndexBuffer(1, buf1);
   SetIndexLabel (1, Symbol());
   SetIndexStyle (1, DRAW_LINE, STYLE_DOT, 1);
   SetIndexEmptyValue(1, 0);
   SetIndexBuffer(2, buf2);
   SetIndexLabel (2, "DOTS");
   SetIndexStyle (2, DRAW_ARROW, 1,3);
   SetIndexArrow (2,164);
   SetIndexEmptyValue(1, 0);
   SetIndexBuffer(3, buf3);
   SetIndexLabel (3, "DOTS");
   SetIndexStyle (3, DRAW_ARROW, 1,3);
   SetIndexArrow (3,164);
   SetIndexEmptyValue(1, 0);
  }

//+------------------------------------------------------------------+
//| Custom indicator deinitialization function                       |
//+------------------------------------------------------------------+
  void deinit()
  {
   Comment("");
  }

//+------------------------------------------------------------------+
//| Custom indicator iteration function                              |
//+------------------------------------------------------------------+
  void start()
  {
   int LoopBegin, sh;
   if (NumberOfBars==0) LoopBegin=Bars-1;
   else LoopBegin=NumberOfBars-1;
   LoopBegin=MathMin(Bars-1, LoopBegin);
   for(sh=LoopBegin; sh>=0; sh--)
     {
      P1=(iClose(NameMain1, 0, sh)*iClose(NameMain2, 0, sh)-iClose(NameCross, 0, sh))*3;
      P2=(iClose(NameMain1, 0, sh)-iClose(NameCross, 0, sh)/iClose(NameMain2, 0, sh))*3;
      P3=(iClose(NameMain2, 0, sh)-iClose(NameCross, 0, sh)/iClose(NameMain1, 0, sh))*3;
        if (Perevorot) {P1=P1*(-1);P2=P2*(-1);P3=P3*(-1);
     }
      C=iClose(Symbol(), 0, sh);
      P1=P1+C;
      P2=P2+C;
      P3=P3+C;
      P=(P1+P2+P3)/3;
      //    Comment(P," ",P1," ",P2," ",P3);
      buf0[sh]=P;
      buf1[sh]=C;
      if (P>C) buf2[sh]=C;
      if (P<C) buf3[sh]=C;
     }
  }
//+------------------------------------------------------------------+
Comments