3D Oscilator
Download script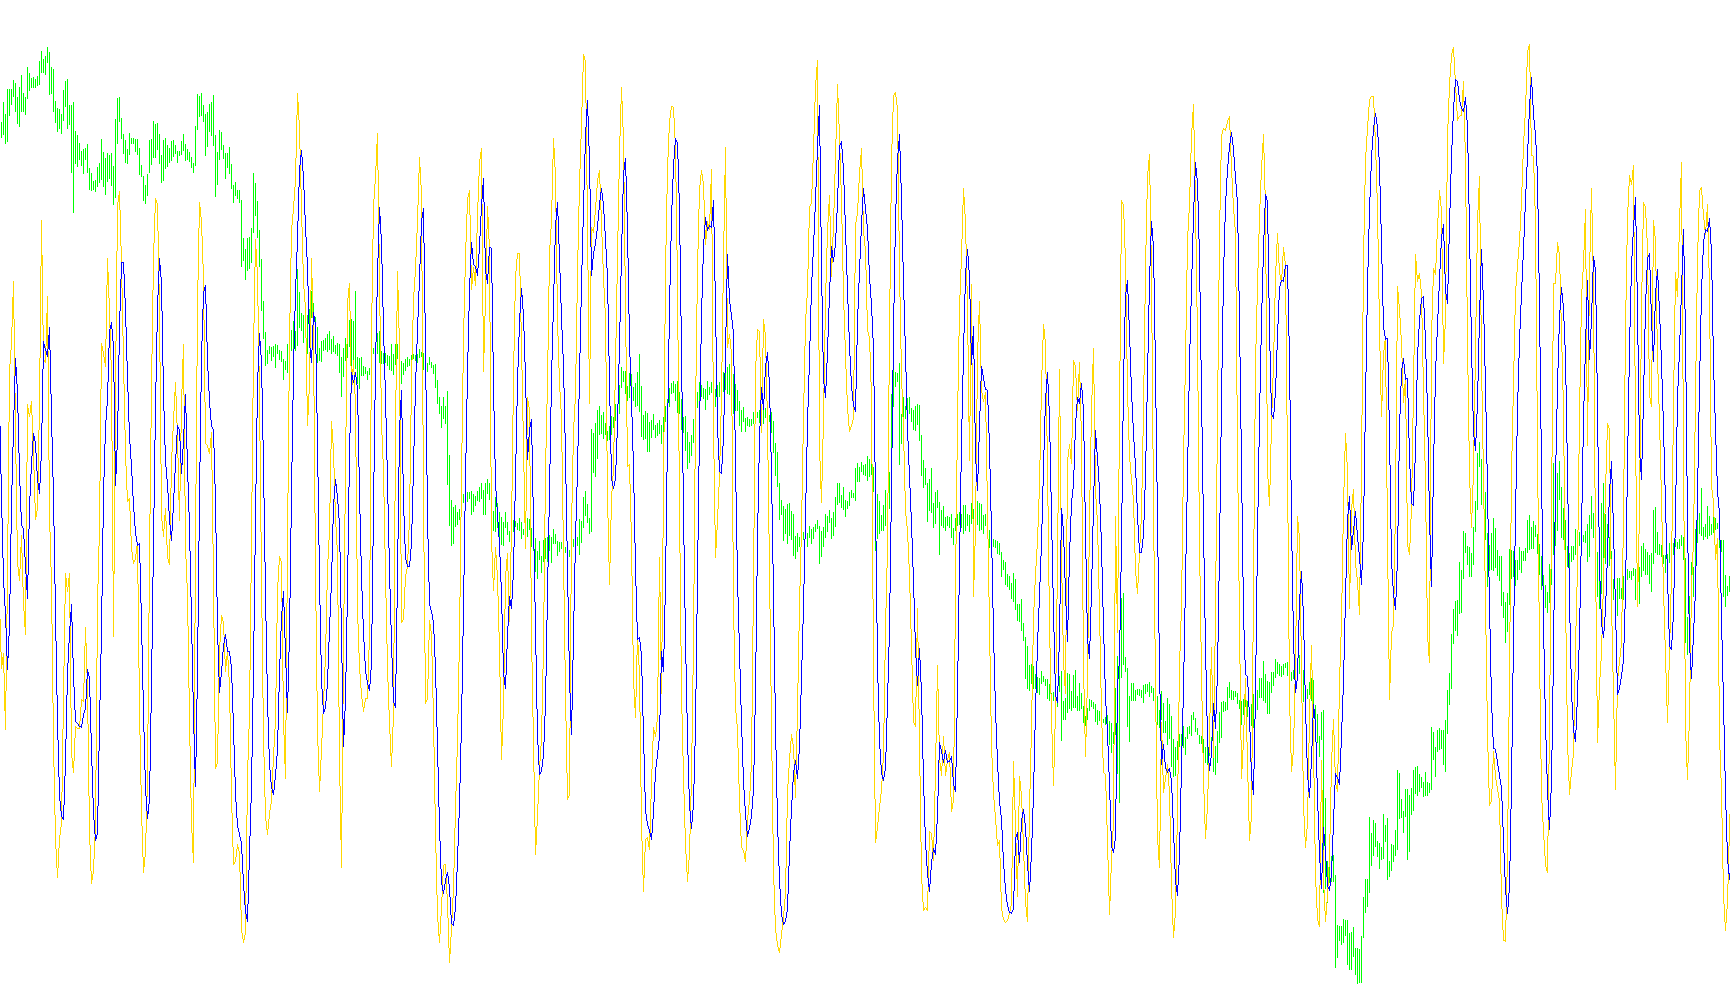
This technical indicator, known as the 3D Oscillator, is designed to provide traders with a visual representation of market momentum by blending three distinct types of price action analysis into a single, cohesive movement. Rather than relying on a single data point, it synthesizes different mathematical perspectives to smooth out market noise and highlight potential trend shifts.
Core Logic and Components
The indicator operates by combining three primary layers of information:
1. The Relative Strength Component (RSI) The tool begins by calculating the Relative Strength Index (RSI). This helps identify whether an asset is overbought or oversold based on past price changes. However, instead of using the RSI value alone, the script analyzes the highest and lowest values within a specific look-back period to determine where the current price sits within that recent range.
2. The Stochastic Integration By identifying the "highs" and "lows" of the RSI mentioned above, the tool calculates a percentage-based position. This effectively tells the user how far the momentum has traveled from its recent extreme points. This calculation transforms standard RSI data into a more sensitive "oscillator" format, making it easier to spot reversals.
3. The Commodity Channel Index (CCI) Blend To add another dimension of depth, the indicator incorporates the Commodity Channel Index (CCI). This component looks at the statistical deviation of price from its average. By mixing this with the momentum data calculated in the previous steps, the indicator creates a "3D" effect—balancing the current trend against historical averages and recent volatility.
Smoothing and Visualization
To ensure the final output is readable and not erratic, the script applies two specific refinement layers:
- Weighted Blending: The tool uses adjustable parameters to determine how much influence each component (RSI, Stochastic, and CCI) should have on the final result. This allows for a customized balance between "fast" reactions to price changes and "slow" confirmation of major trends.
- Signal Smoothing: The indicator generates two distinct lines. One represents the primary momentum movement, while the second acts as a smoothed signal line. By comparing these two lines, traders can identify when momentum is accelerating or decelerating, providing a clearer picture of the market's direction than raw price action alone.
Summary for the User
In practical terms, this script acts as a multi-layered filter. It looks at how much an asset has moved recently (RSI), where that move sits relative to recent highs and lows (Stochastic), and how far it has strayed from its normal average (CCI). The final result is a dual-line oscillator that helps filter out "market chatter," aiming to provide a clearer view of the underlying strength of a currency pair or asset.
//+------------------------------------------------------------------+
//|                                                 3D Oscilator.mq4 |
//|                                                                  |
//|                                                                  |
//+------------------------------------------------------------------+
#property copyright "Author - Luis Damiani. Ramdass - Conversion only"

#property indicator_separate_window
#property indicator_buffers 2
#property indicator_color1 Yellow
#property indicator_color2 Red
//---- input parameters

extern int D1RSIPer=13;
extern int D2StochPer=8;
extern int D3tunnelPer=8;
extern double hot=0.4;
extern int sigsmooth=4;


//---- buffers
double sig1n[];
double sig2n[];
//+------------------------------------------------------------------+
//| Custom indicator initialization function                         |
//+------------------------------------------------------------------+
int init()
  {
   string short_name;
//---- indicator line
   SetIndexStyle(0,DRAW_LINE);
   SetIndexStyle(1,DRAW_LINE);
   SetIndexBuffer(0,sig1n);
   SetIndexBuffer(1,sig2n);
//----
   SetIndexDrawBegin(0,D1RSIPer+D2StochPer+D3tunnelPer+hot+sigsmooth);
   SetIndexDrawBegin(1,D1RSIPer+D2StochPer+D3tunnelPer+hot+sigsmooth);
//----
   return(0);
  }
//+------------------------------------------------------------------+
//| CCI_Woodies                                                         |
//+------------------------------------------------------------------+
int start()
  {
   int i,i2,counted_bars=IndicatorCounted();
   double rsi,maxrsi,minrsi,storsi,E3D,
   sig1,sig2,sk,ss,sk2;
   double cs;
   bool init=true;
//----
   cs= D1RSIPer+D2StochPer+D3tunnelPer+hot+sigsmooth;
   if(Bars<=cs) return(0);

//if (init)
//{
ss=sigsmooth;
if (ss<2) ss=2;
sk = 2 / (ss + 1);
sk2=2/(ss*0.8+1);
init=false;
//};


//---- initial zero
   if(counted_bars<1)
   {
      for(i=1;i<=cs;i++) sig1n[Bars-i]=0.0;
      for(i=1;i<=cs;i++) sig2n[Bars-i]=0.0;
   }
//----
   i=Bars-cs-1;


   if(counted_bars>=cs) i=Bars-counted_bars-1;
   while(i>=0)
     {

      rsi=iRSI(NULL,0,D1RSIPer,PRICE_CLOSE,i);
maxrsi=rsi;
minrsi=rsi;

for (i2=i+D2StochPer;i2>=i; i2--)
{
rsi=iRSI(NULL,0,D1RSIPer,PRICE_CLOSE,i2);
if (rsi>maxrsi) maxrsi=rsi;
if (rsi<minrsi) minrsi=rsi;
//maxrsi=Maximum(rsi,maxrsi);
//minrsi=min(rsi,minrsi);
}

storsi=((rsi-minrsi)/(maxrsi-minrsi)*200-100);
E3D=hot*iCCI(NULL,0,D3tunnelPer,PRICE_TYPICAL,i)+(1-hot)*storsi;
sig1n[i]=sk*E3D+(1-sk)*sig1;
sig2n[i]=sk2*sig1+(1-sk2)*sig2;
sig1=sig1n[i];
sig2=sig2n[i];

      i--;
     }
   return(0);
  }
//+------------------------------------------------------------------+
Comments