MFI_OsWAD_macdosma4c
Download script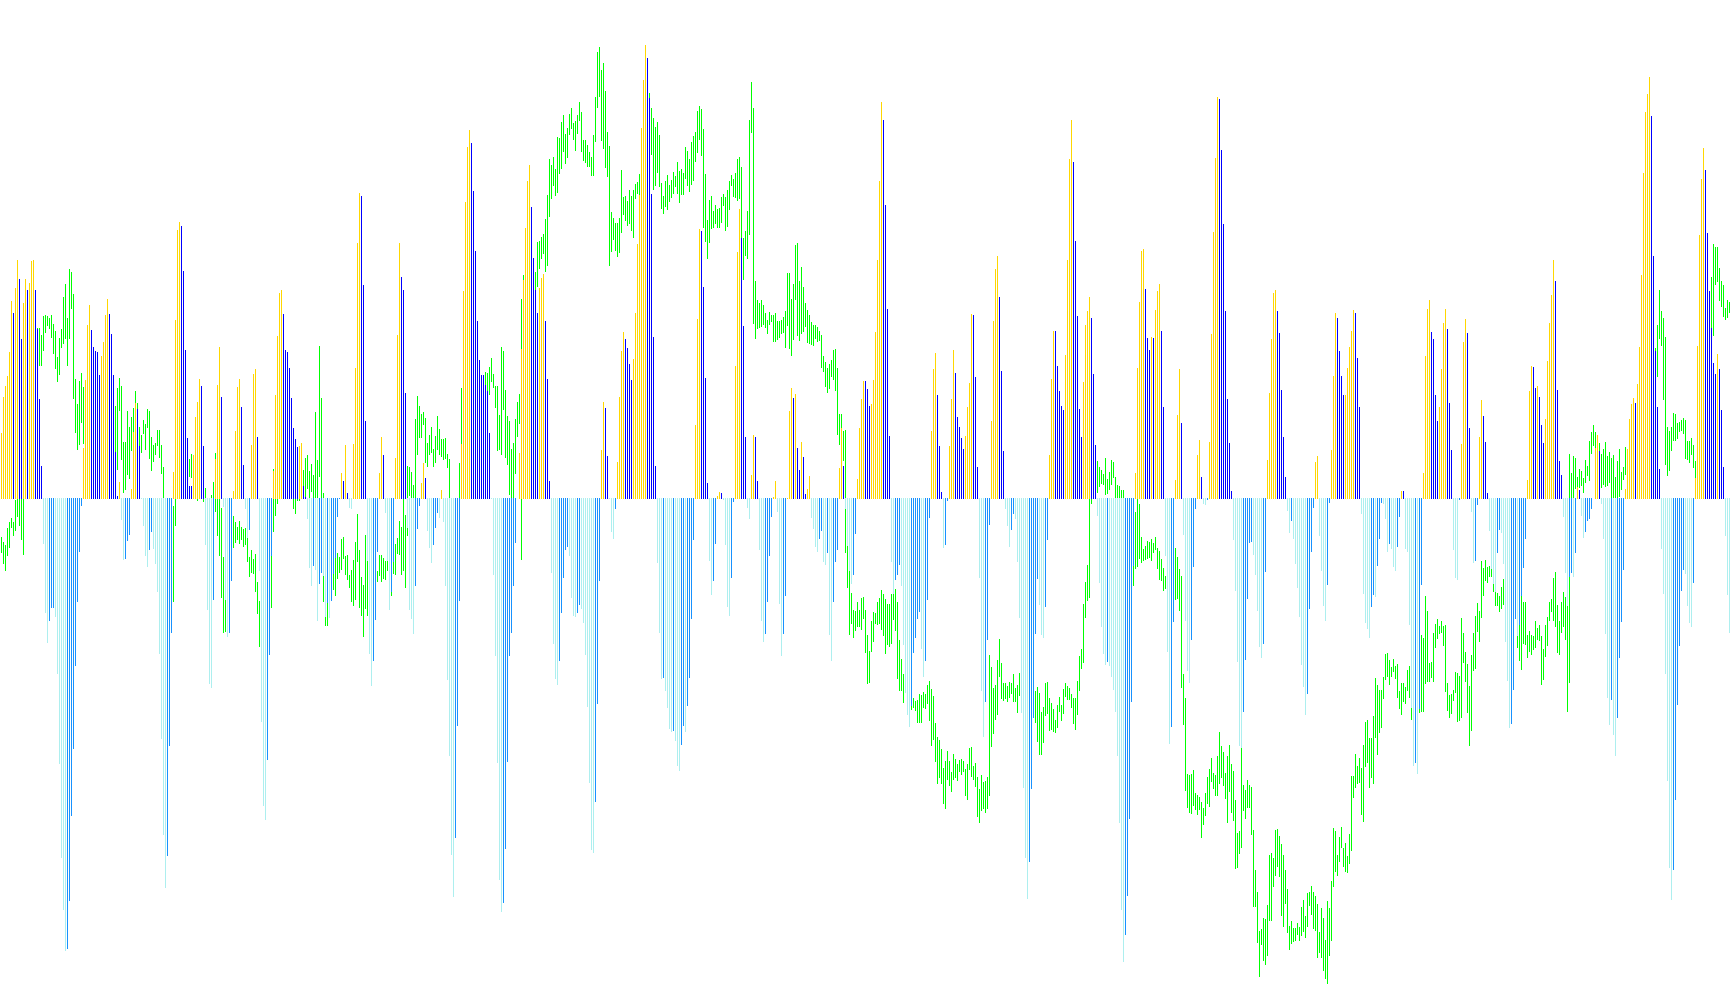
This technical indicator is designed to provide traders with a visual representation of market momentum and trend direction by combining several sophisticated mathematical layers. Rather than looking at raw price alone, the script analyzes the "flow" of money and movement to help identify potential shifts in market sentiment.
Core Logic Breakdown
1. Foundation: Money Flow Analysis The script begins by tracking the Money Flow Index (MFI). Think of this as a volume-weighted version of momentum; it looks at how much capital is moving into or out of an asset. It evaluates this data over two different time horizons (short and long periods) simultaneously to establish a baseline of market activity.
2. Momentum Filtering Once the money flow data is gathered, the script calculates the difference between the short-term and long-term flows. By subtracting one from the other, it creates a "momentum" value. This allows the tool to strip away the noise of minor price fluctuations and focus on the underlying strength of the current move.
3. Smoothing and Signal Processing To ensure the data is readable and not too erratic for a human trader, the script applies several layers of moving averages. It takes the momentum values and smooths them out again to identify "signals." Depending on your settings, it can also include an additional "Oscillator" component to further refine these signals, helping to distinguish between active trends and stagnant periods.
4. Visual Representation (The Histogram) The final output is translated into a four-color histogram system that categorizes the market state into specific behaviors:
- Positive Momentum (Upward Force): When the flow is moving up, the script identifies if the strength is increasing or decreasing. If it is gaining strength, it highlights it with one specific color; if that strength begins to wane, it switches to another.
- Negative Momentum (Downward Force): Conversely, when the flow is moving down, the script detects whether the downward pressure is accelerating or decelerating, using two distinct colors to differentiate these states.
Summary for the User
In practical terms, this tool acts as a sophisticated "momentum thermometer." It tells you not just which way the market is leaning, but how aggressively it is moving in that direction. By observing the color changes and histogram heights, you can see when a trend is gaining steam, when it is losing its power, or when a potential reversal might be forming based on the underlying flow of capital.
//+------------------------------------------------------------------+
//
// Bookkeeper: Îñöèëëÿòîð íà îñíîâå èíäèêàòîðà:
//+------------------------------------------------------------------+
//|                                         Waddah_Attar_Def_RSI.mq4 |
//|                              Copyright © 2007, Eng. Waddah Attar |
//|                                          waddahattar@hotmail.com |
//+------------------------------------------------------------------+
//----
#property  indicator_separate_window
#property  indicator_buffers 4
#property  indicator_color1  Lime
#property  indicator_color2  Green
#property  indicator_color3  Red
#property  indicator_color4  Maroon

#property indicator_width1   2
#property indicator_width2   2
#property indicator_width3   2
#property indicator_width4   2

//----
extern int Period1=14;
extern int Period2=28;

extern int smzPeriod1=5;
extern int smzPeriod2=13;
extern int sigPeriod =7;

extern bool showOsma=true;

double   up_buffer1[];
double   up_buffer2[];
double   dn_buffer1[];
double   dn_buffer2[];
double   ind_buffer1[];
double   ind_buffer2[];
double   ind_buffer3[];
double   MABuffer1[];

//+------------------------------------------------------------------+
//|                                                                  |
//+------------------------------------------------------------------+
int init()
  {
   IndicatorBuffers(8);
   SetIndexStyle(0, DRAW_HISTOGRAM);
   SetIndexStyle(1, DRAW_HISTOGRAM);
   SetIndexStyle(2, DRAW_HISTOGRAM);
   SetIndexStyle(3, DRAW_HISTOGRAM);
//----
   SetIndexBuffer(0, up_buffer1);
   SetIndexBuffer(1, up_buffer2);
   SetIndexBuffer(2, dn_buffer1);
   SetIndexBuffer(3, dn_buffer2);
   SetIndexBuffer(4, ind_buffer1);
   SetIndexBuffer(5, MABuffer1);
   SetIndexBuffer(6, ind_buffer2);
   SetIndexBuffer(7, ind_buffer3);
//----
   string snm="macd";if (showOsma)snm="osma";

   IndicatorShortName("OsWAD MFI ("+Period1+","+Period2+") "+snm);

   return(0);
  }
//+------------------------------------------------------------------+
//|                                                                  |
//+------------------------------------------------------------------+
int deinit()
  {
//----
   return(0);
  }
//+------------------------------------------------------------------+
//|                                                                  |
//+------------------------------------------------------------------+
int start()
  {
   double RSI1,RSI2,Explo;

   int  limit, i, counted_bars = IndicatorCounted();
//----
   if(counted_bars < 0)
       return(-1);
//----
   if(counted_bars > 0)
       counted_bars--;
   limit = Bars - counted_bars;
//----
   for(i = limit; i >= 0; i--)
   {
     MABuffer1[i]   = iMFI(NULL, 0, Period1, i);
     ind_buffer1[i] = iMFI(NULL, 0, Period2, i);
   }


   for(i = 0; i <= limit; i++)
     ind_buffer2[i]= iMAOnArray(MABuffer1,0,smzPeriod1,0,MODE_SMA,i)-
                     iMAOnArray(ind_buffer1,0,smzPeriod2,0,MODE_SMA,i);

   for(i = 0; i <= limit; i++)
     ind_buffer3[i]= iMAOnArray(ind_buffer2,0,sigPeriod,0,MODE_SMA,i);


   for(i = 0; i <= limit; i++)
   {
            double os = 0.0, os1 = 0.0;
                        if (showOsma)  {  os  =ind_buffer3[i];
                                          os1 =ind_buffer3[i+1];
                                          }

      double  curr =ind_buffer2[i]  -os;
      double  prev =ind_buffer2[i+1]-os1;


     if(curr >0)
     {
        dn_buffer1[i]=0;
        dn_buffer2[i]=0;
        if(curr>prev)
        {
           up_buffer1[i]=curr;
           up_buffer2[i]=0;
        }
        else
        {
           up_buffer1[i]=0;
           up_buffer2[i]=curr;
        }
     }
     else
     {
        up_buffer1[i]=0;
        up_buffer2[i]=0;
        if(curr<prev)
        {
           dn_buffer1[i]=curr;
           dn_buffer2[i]=0;
        }
        else
        {
           dn_buffer1[i]=0;
           dn_buffer2[i]=curr;
        }
     }
   }
   return(0);
}
//+------------------------------------------------------------------+
Comments