Median+ATRm
Download script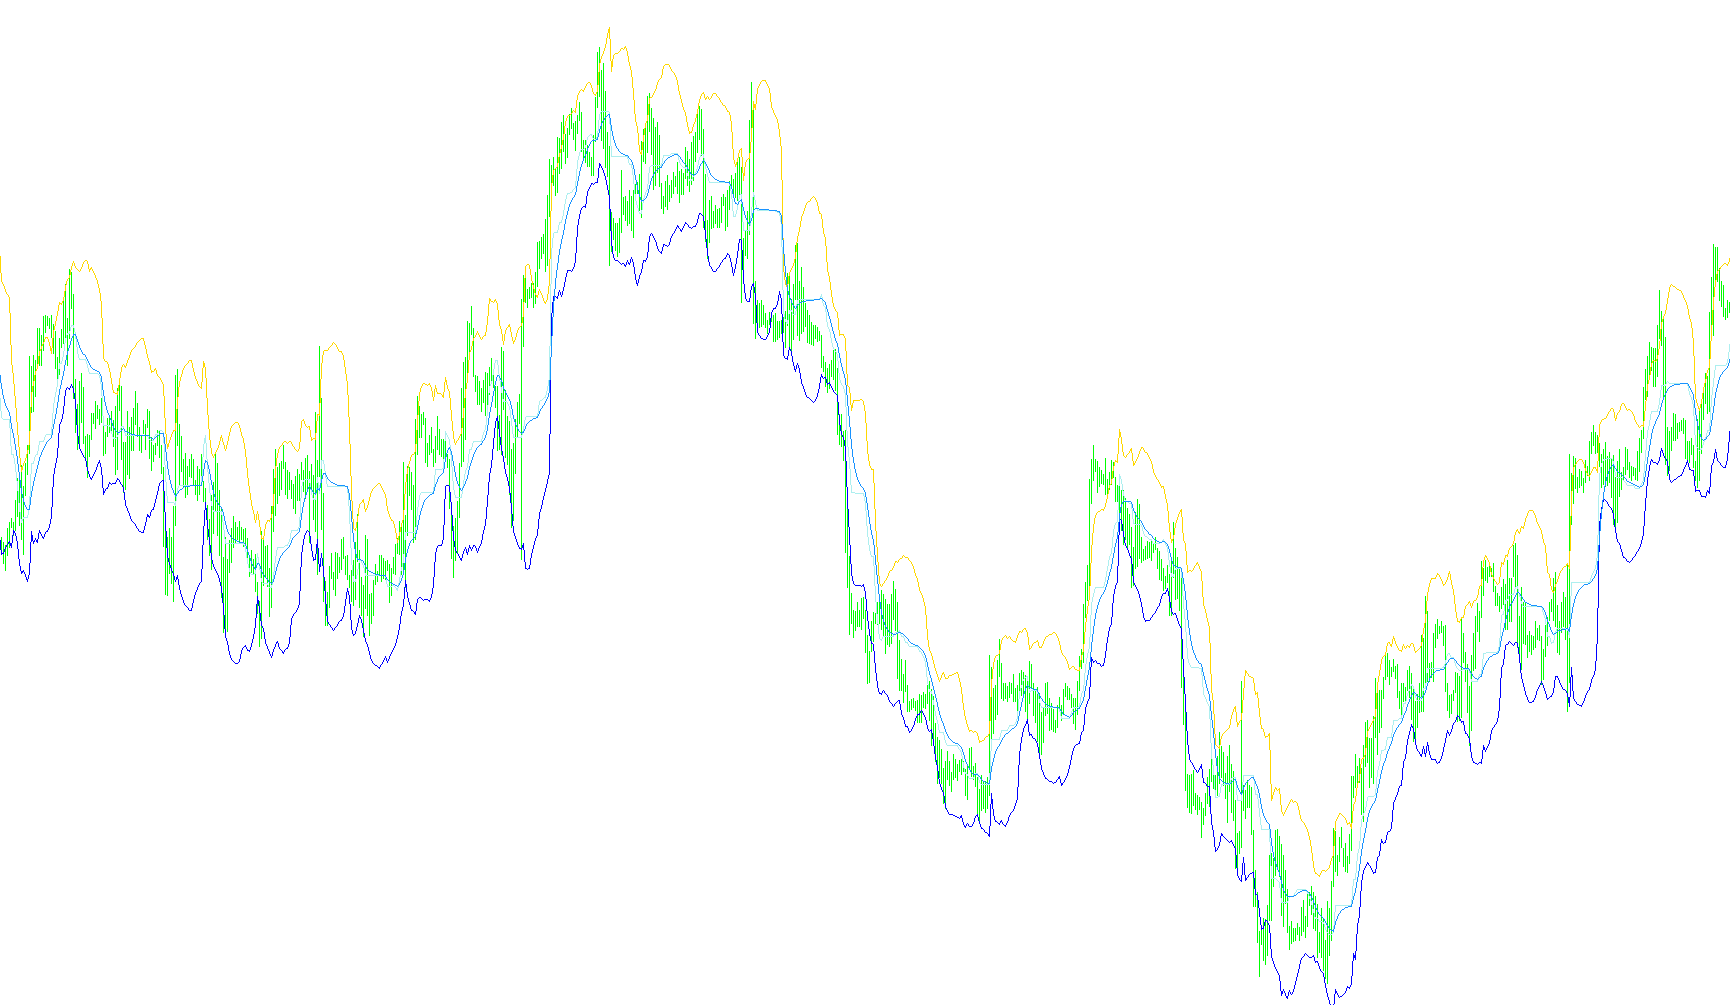
This tool is designed as a visual price analysis indicator for trading charts. Its primary purpose is to identify the core price structure of the market by calculating "boundaries" and a "signal" line based on historical price movements and volatility.
Core Logic Overview
The script operates by analyzing past price data (specifically high and low prices) over a set period to determine three distinct visual components:
1. The Market Boundaries (High and Low) The indicator constantly scans the most recent price candles to find the highest peak and the lowest valley within a specific timeframe.
- It calculates a Middle Line, which is the mathematical halfway point between that high and low.
- It then determines the market's volatility by measuring the average range of price movement (the distance between highs and lows over time).
- Using this volatility measurement, it creates an Upper Boundary (the middle point plus a specific multiplier of volatility) and a Lower Boundary (the middle point minus that same multiplier).
Essentially, these boundaries act as a dynamic "channel" that expands when the market is moving aggressively and contracts when the market is stable.
2. The Signal Line (Smooth Median) While the boundaries show the immediate range of the market, the script also calculates a smoothed version of the middle price. It takes the average middle points generated in the previous step and applies an exponential smoothing technique. This results in a "Signal" line that filters out minor market noise, making it easier to see the underlying trend of the price action.
Visual Representation
When applied to a chart, these calculations are translated into four distinct visual elements:
- Upper Boundary: Represents the ceiling of the current price action.
- Lower Boundary: Represents the floor of the current price action.
- Middle Line: Shows the equilibrium point between the high and low.
- Signal Line: A smoothed path that helps users identify the broader direction of the market trend.
By combining these four elements, the tool provides a comprehensive view of where the price is currently trading, how much "room" it has to move before hitting a boundary, and whether the overall trend is leaning toward the top or bottom of that range.
//+------------------------------------------------------------------+
//|                                                       Median.mq4 |
//|                      Copyright © 2004, MetaQuotes Software Corp. |
//|                                        http://www.metaquotes.net |
//+------------------------------------------------------------------+
#property copyright "Rosh"
#property link      "http://www.metaquotes.net"
//----
#property indicator_chart_window
#property indicator_buffers 4
#property indicator_color1 Aqua
#property indicator_color2 Aqua
#property indicator_color3 Yellow
#property indicator_color4 Red

//----
extern int per=14;
extern int Dep=300;
extern double K_ATR=2.0;
extern int Period_ATR=13;
extern int SmzPeriod =5;

//---- indicator buffers
double UpBuffer[];
double DownBuffer[];
double MidlleBuffer[];
double SmoothMedian[];

//----
int ExtCountedBars=0;
int LastCalcTime=0;
int LastPeriod=0;
int shift=0;
double mmin=0;
double mmax=0;
//+------------------------------------------------------------------+
//| Custom indicator initialization function                         |
//+------------------------------------------------------------------+
int init()
  {
//   IndicatorBuffers(6);
   SetIndexStyle(0,DRAW_LINE);
   SetIndexShift(0,0);
   IndicatorDigits(MarketInfo(Symbol(),MODE_DIGITS));
   SetIndexStyle(1,DRAW_LINE);
   SetIndexShift(1,0);
   SetIndexStyle(2,DRAW_LINE);
   SetIndexShift(2,0);
   SetIndexStyle(3,DRAW_LINE);
   SetIndexShift(3,0);
//----
   SetIndexBuffer(0,UpBuffer);
   SetIndexBuffer(1,DownBuffer);
   SetIndexBuffer(2,MidlleBuffer);
   SetIndexBuffer(3,SmoothMedian);

//----
   SetIndexLabel(0,"Hi");
   SetIndexLabel(1,"Low");
   SetIndexLabel(2,"Midlle");
   SetIndexLabel(3,"Signal");
//---- indicators
   return(0);
  }
//+------------------------------------------------------------------+
//| Custor indicator deinitialization function                       |
//+------------------------------------------------------------------+
int deinit()
  {
//---- TODO: add your code here
//----
   return(0);
  }
//+------------------------------------------------------------------+
//| Custom indicator iteration function                              |
//+------------------------------------------------------------------+
int start()
  {
   double ATR;
   int limit;
   int counter;
   int    counted_bars=IndicatorCounted();
   if(counted_bars<0) return(-1);
//---- TODO: add your code here
   if(counted_bars>0) counted_bars--;
   limit=Bars-counted_bars;
   for(shift=limit;shift>=1;shift-- )
     {
      mmin=Low[Lowest(NULL,0,MODE_LOW,per,shift)];
      mmax=High[Highest(NULL,0,MODE_HIGH,per,shift)];
      ATR=0;
      for(counter=Period_ATR;counter>=1;counter--)
        {
         ATR=ATR+MathAbs(High[shift+counter]-Low[shift+counter]);
        }
      ATR=ATR/Period_ATR;
      MidlleBuffer[shift-1]=(mmax+mmin)/2;
      UpBuffer[shift-1]=MidlleBuffer[shift-1]+ATR*K_ATR;
      DownBuffer[shift-1]=MidlleBuffer[shift-1]-ATR*K_ATR;
     }
   for(shift=limit;shift>=1;shift-- )
     {SmoothMedian[shift-1]=iMAOnArray(MidlleBuffer,Bars,SmzPeriod,0,MODE_EMA,shift-1);

     }


//----
   //return;
  }
//+------------------------------------------------------------------+
Comments