MidDay
Download script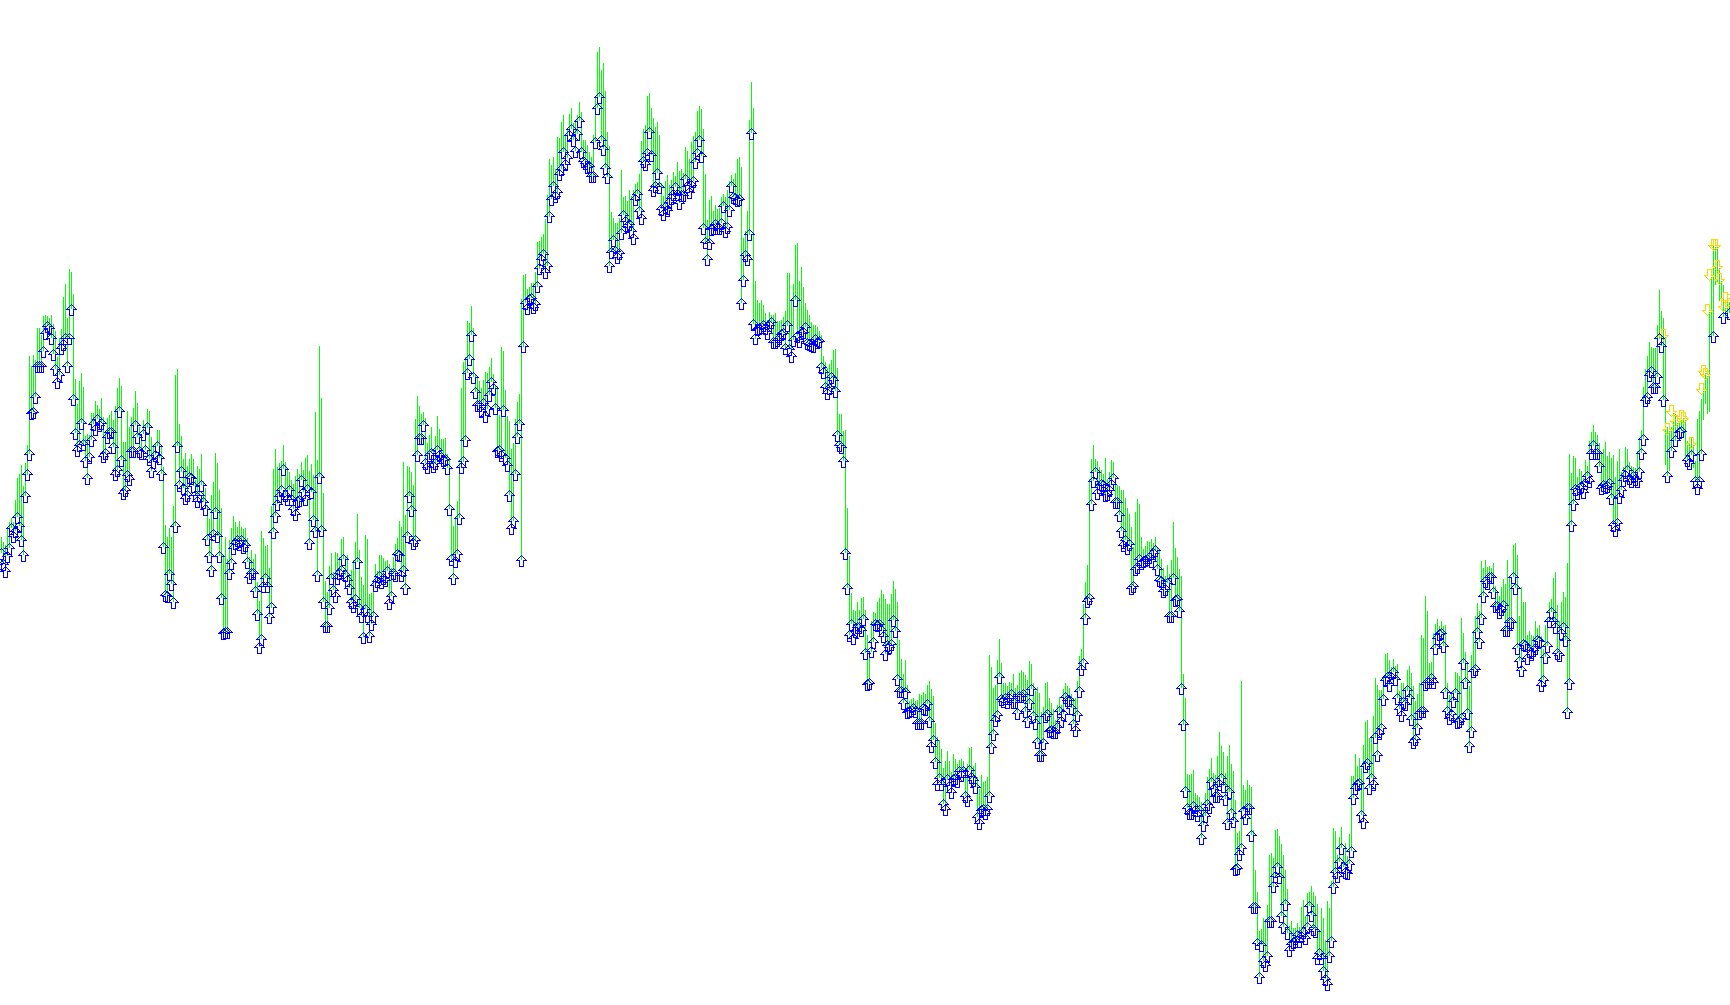
This tool is designed to act as a visual signal guide on your trading chart, providing clear markers to help identify potential momentum shifts. It functions by analyzing the underlying price action through a specific technical lens and translating that data into intuitive "Buy" and "Sell" arrows.
How the Logic Works
The core logic of this script relies on monitoring the speed and change of price movements over time. It specifically looks at a common market momentum indicator (the RSI) but applies it in a unique way:
- Multi-Timeframe Analysis: While you may be looking at a larger timeframe chart (like a 15-minute or 1-hour chart), the script "looks inside" those candles to analyze what is happening on a 1-minute basis. This allows it to capture smaller, faster movements that might not be visible on your main screen.
- The Momentum Threshold: The script constantly checks whether the momentum on that 1-minute timeframe is currently trending above or below a middle "neutral" point (the value of 50).
Visual Signals on Your Chart
Based on this analysis, the script places visual markers directly on your chart to guide your view:
- Sell Signals: When the momentum moves significantly above the neutral threshold, the script identifies a potential upward exhaustion or strength. It places a specific arrow (colored Light Blue) above the price candles to signal these areas.
- Buy Signals: When the momentum drops below that same neutral threshold, the script identifies downward pressure or a potential reversal point. It places an opposing arrow (colored Red) below the price candles to highlight these opportunities.
Summary for Traders
In simple terms, this script acts as a filter. It sifts through the "noise" of the 1-minute charts and summarizes the sentiment onto your current view. It tells you: "Based on the fastest moving parts of the market right now, the momentum is leaning in this direction," allowing you to spot potential entry points more quickly without having to manually switch between different timeframes.
//+--------------------------------------------------------------------+
//|                                                          MidDay.mq4|
//|                              Copyright © 2008, Sugeng Pudjiono     |
//|                                       http://www.payroll-kita.com/ |
//+--------------------------------------------------------------------+
#property copyright "Copyright © 2007, Sugeng Pudjiono"
#property link      "http://www.payroll-kita.com/"
#property indicator_chart_window
#property indicator_buffers 2
#property indicator_color1 LightBlue
#property indicator_color2 Red

int deinit()
  {
  GlobalVariablesDeleteAll();
  return(0);
  }


//---- input parameters

//---- indicator buffers
double ExtTopBuffer[];
double ExtBotBuffer[];
//+------------------------------------------------------------------+
//| Custom indicator initialization function                         |
//+------------------------------------------------------------------+


int init()
  {
   SetIndexShift(0,0);
   SetIndexDrawBegin(0,0);
   SetIndexBuffer(0,ExtTopBuffer);
   SetIndexStyle(0,DRAW_ARROW);
   SetIndexArrow(0,242);
   SetIndexLabel(0,"Sell");

   SetIndexShift(1,0);
   SetIndexDrawBegin(1,0);
   SetIndexBuffer(1,ExtBotBuffer);
   SetIndexStyle(1,DRAW_ARROW);
   SetIndexArrow(1,241);
   SetIndexLabel(1,"Buy");
   return(0);
  }


int start()
  {
   int limit;
   int counted_bars=IndicatorCounted();
   if(counted_bars<0) return(-1);
   limit=WindowFirstVisibleBar()+96*2;
   int IndexM1, SisaIndex;
   SisaIndex = MathMod(TimeMinute(TimeCurrent()),Period());
   for(int i=limit; i>-1; i--)
     {
       IndexM1=i*Period()+SisaIndex;
       if(iRSI(NULL,PERIOD_M1,14,PRICE_CLOSE,IndexM1)>50)
         {
            ExtTopBuffer[i]=High[i]+5*Point;
            ExtBotBuffer[i]=0;
         }
       if(iRSI(NULL,PERIOD_M1,14,PRICE_CLOSE,IndexM1)<=50)
         {
            ExtTopBuffer[i]=0;
            ExtBotBuffer[i]=Low[i]-5*Point;
         }
     }

  return(0);
  }
Comments