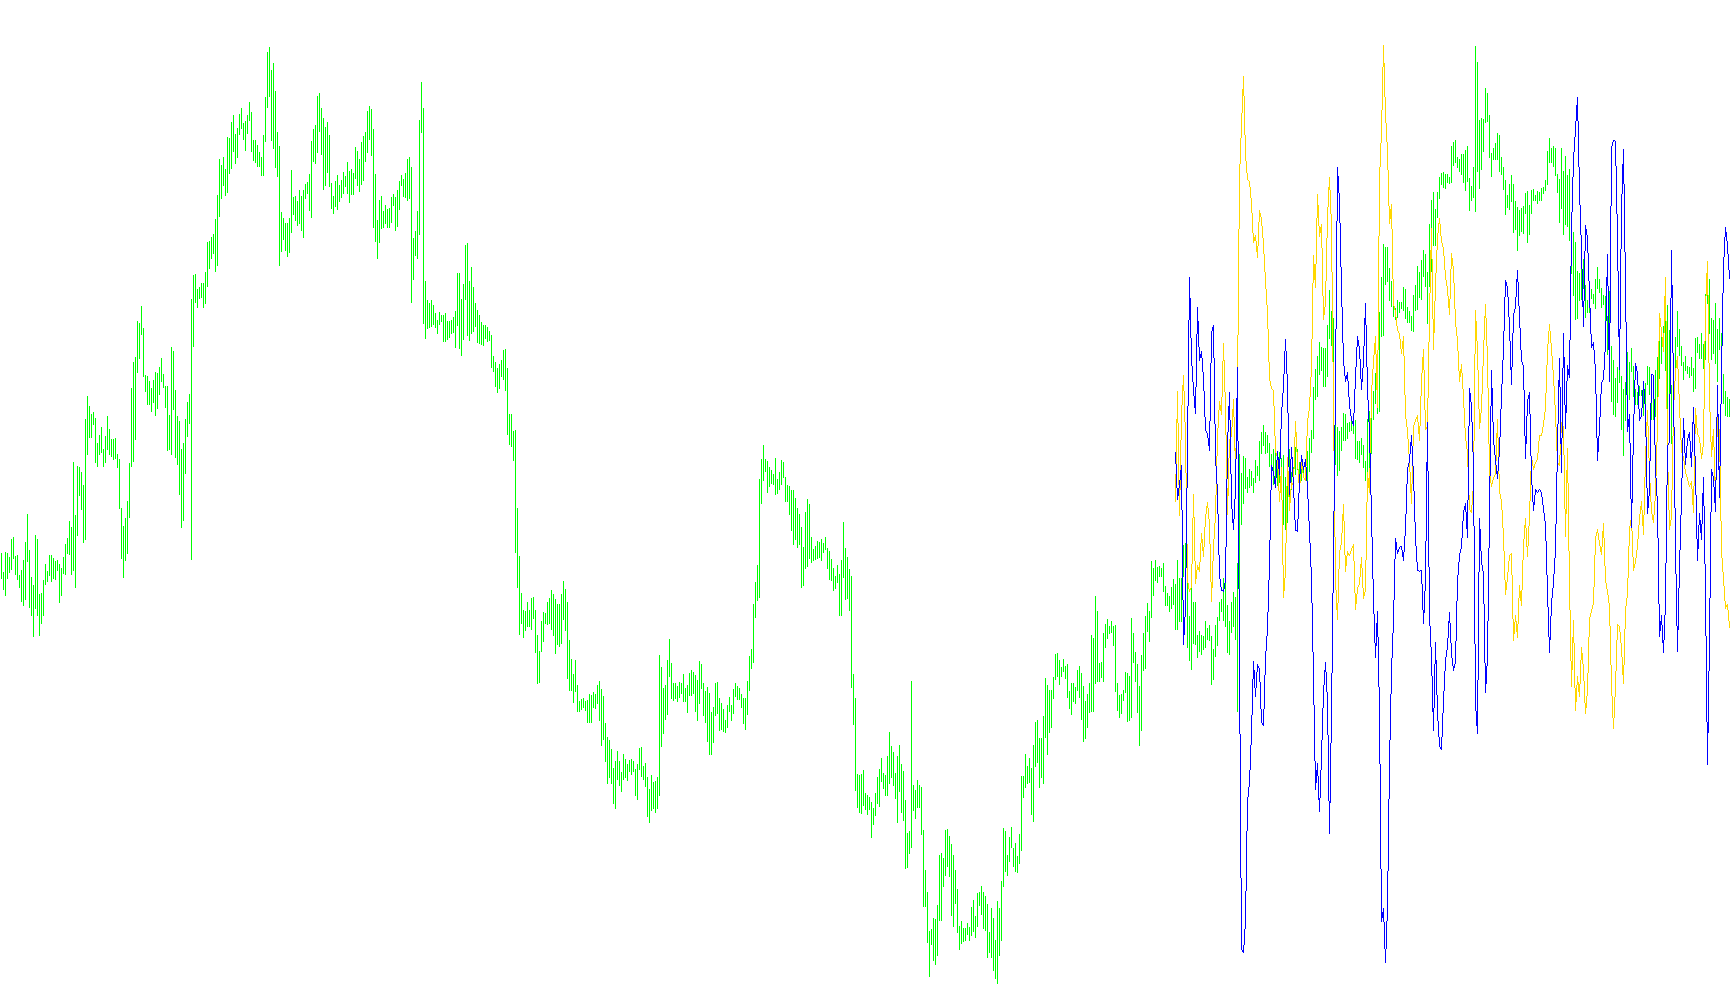
This tool is designed as a visual trend indicator for MetaTrader, providing traders with a dedicated window to analyze market momentum and price behavior. Rather than cluttering the main price chart, it calculates two distinct data streams to help identify underlying market shifts.
How the Logic Works
The script operates by processing historical market data over a specific number of bars to generate two primary lines:
1. The Trend Analysis Line (Blue) This component measures the distance between the current market price and a standard volatility band (similar to Bollinger Bands). By calculating how far the actual price has moved away from its "normal" expected range—based on settings like period and deviation—the script identifies the strength of the trend. It allows users to choose which specific price points (such as Open, High, Low, or Close) are used for this calculation, providing flexibility depending on the trading style.
2. The Power Balance Line (Red) This component focuses on "Power" dynamics. It calculates the relationship between bullish and bearish momentum within a specific timeframe. By combining these forces into a single value, the script highlights the intensity of the movement. Essentially, it helps visualize whether the current price action is being driven by aggressive buying, selling, or a neutral equilibrium.
Key Features for Users
- Customizable Sensitivity: You can adjust the "Bands Period" and "Power Period" to make the indicator more reactive to quick price spikes or smoother to filter out minor market noise.
- Price Source Selection: The logic allows you to switch between various price types (such as Typical, Weighted, or Median prices). This is useful for different asset classes (like Forex vs. Stocks) where "Close" price might not be the most reliable metric.
- Dual-Layer Visualization: By looking at both the Blue and Red lines simultaneously, you can see not just where the price is going, but the force behind the movement. If the trend line is expanding while the power line shows significant activity, it indicates a strong, high-conviction move in the market.
In summary, this script transforms raw price data into a simplified visual map of market volatility and momentum, helping you stay ahead of trends by seeing the "push" behind the price action.
/*-----------------------------+
|			       |
| Shared by www.Aptrafx.com    |
|			       |
+------------------------------*/

//+------------------------------------------------------------------+
//|                                                        Trend.mq4 |
//|                                                                  |
//|                                        Ramdass - Conversion only |
//+------------------------------------------------------------------+

#property indicator_separate_window
#property indicator_buffers 2
#property indicator_color1 Blue
#property indicator_color2 Red
//---- input parameters
extern int Bands_Mode_0_2=0;  // =0-2 MODE_MAIN, MODE_LOW, MODE_HIGH
extern int Power_Price_0_6=0; // =0-6 PRICE_CLOSE,PRICE_OPEN,PRICE_HIGH,PRICE_LOW,PRICE_MEDIAN,PRICE_TYPICAL,PRICE_WEIGHTED
extern int Price_Type_0_3=0;  // =0-3 PRICE_CLOSE,PRICE_OPEN,PRICE_HIGH,PRICE_LOW
extern int Bands_Period=20;
extern int Bands_Deviation=2;
extern int Power_Period=13;
extern int CountBars=300;
//---- buffers
double value[];
double value2[];
//+------------------------------------------------------------------+
//| Custom indicator initialization function                         |
//+------------------------------------------------------------------+
int init()
  {
//   string short_name;
//---- indicator line
   IndicatorBuffers(2);
   SetIndexStyle(0,DRAW_LINE);
   SetIndexStyle(1,DRAW_LINE);
   SetIndexBuffer(0,value);
   SetIndexBuffer(1,value2);
//----

//----
   return(0);
  }
//+------------------------------------------------------------------+
//| Trend                                                         |
//+------------------------------------------------------------------+
int start()
  {
   SetIndexDrawBegin(0,Bars-CountBars+Bands_Period+1);
   SetIndexDrawBegin(1,Bars-CountBars+Bands_Period+1);
   int i,CurrentBar,Bands_Mode,counted_bars=IndicatorCounted();
   double Power_Price,CurrentPrice;
//----
   if(Bars<=Bands_Period) return(0);
//---- initial zero
   if(counted_bars<Bands_Period)
   {
      for(i=1;i<=Bands_Period;i++) value[Bars-i]=0.0;
      for(i=1;i<=Bands_Period;i++) value2[Bars-i]=0.0;
   }
//----
   i=CountBars-Bands_Period-1;
   if(counted_bars>=Bands_Period) i=CountBars-counted_bars-1;


if (Bands_Mode_0_2==1) Bands_Mode=MODE_LOW;
if (Bands_Mode_0_2==2) Bands_Mode=MODE_HIGH;
if (Bands_Mode_0_2==0) Bands_Mode=MODE_MAIN;

if (Power_Price_0_6==1) Power_Price=PRICE_OPEN;
if (Power_Price_0_6==2) Power_Price=PRICE_HIGH;
if (Power_Price_0_6==3) Power_Price=PRICE_LOW;
if (Power_Price_0_6==4) Power_Price=PRICE_MEDIAN;
if (Power_Price_0_6==5) Power_Price=PRICE_TYPICAL;
if (Power_Price_0_6==6) Power_Price=PRICE_WEIGHTED;
if (Power_Price_0_6==6) Power_Price=PRICE_CLOSE;

for (i=CountBars-1; i>=0; i--)
{
  if (Price_Type_0_3==1) CurrentPrice=Open[i];

  if (Price_Type_0_3==2) CurrentPrice=High[i];

  if (Price_Type_0_3==3) CurrentPrice=Low[i];
  if (Price_Type_0_3==0) CurrentPrice=Close[i];

  value[i]=CurrentPrice-iBands(NULL,0,Bands_Period,Bands_Deviation,0,Bands_Mode,Power_Price,i);
  value2[i]=-(iBearsPower(NULL,0,Power_Period,Power_Price,i)+iBullsPower(NULL,0,Power_Period,Power_Price,i));

}


   return(0);
  }
//+------------------------------------------------------------------+
Comments