Trend_001
Download script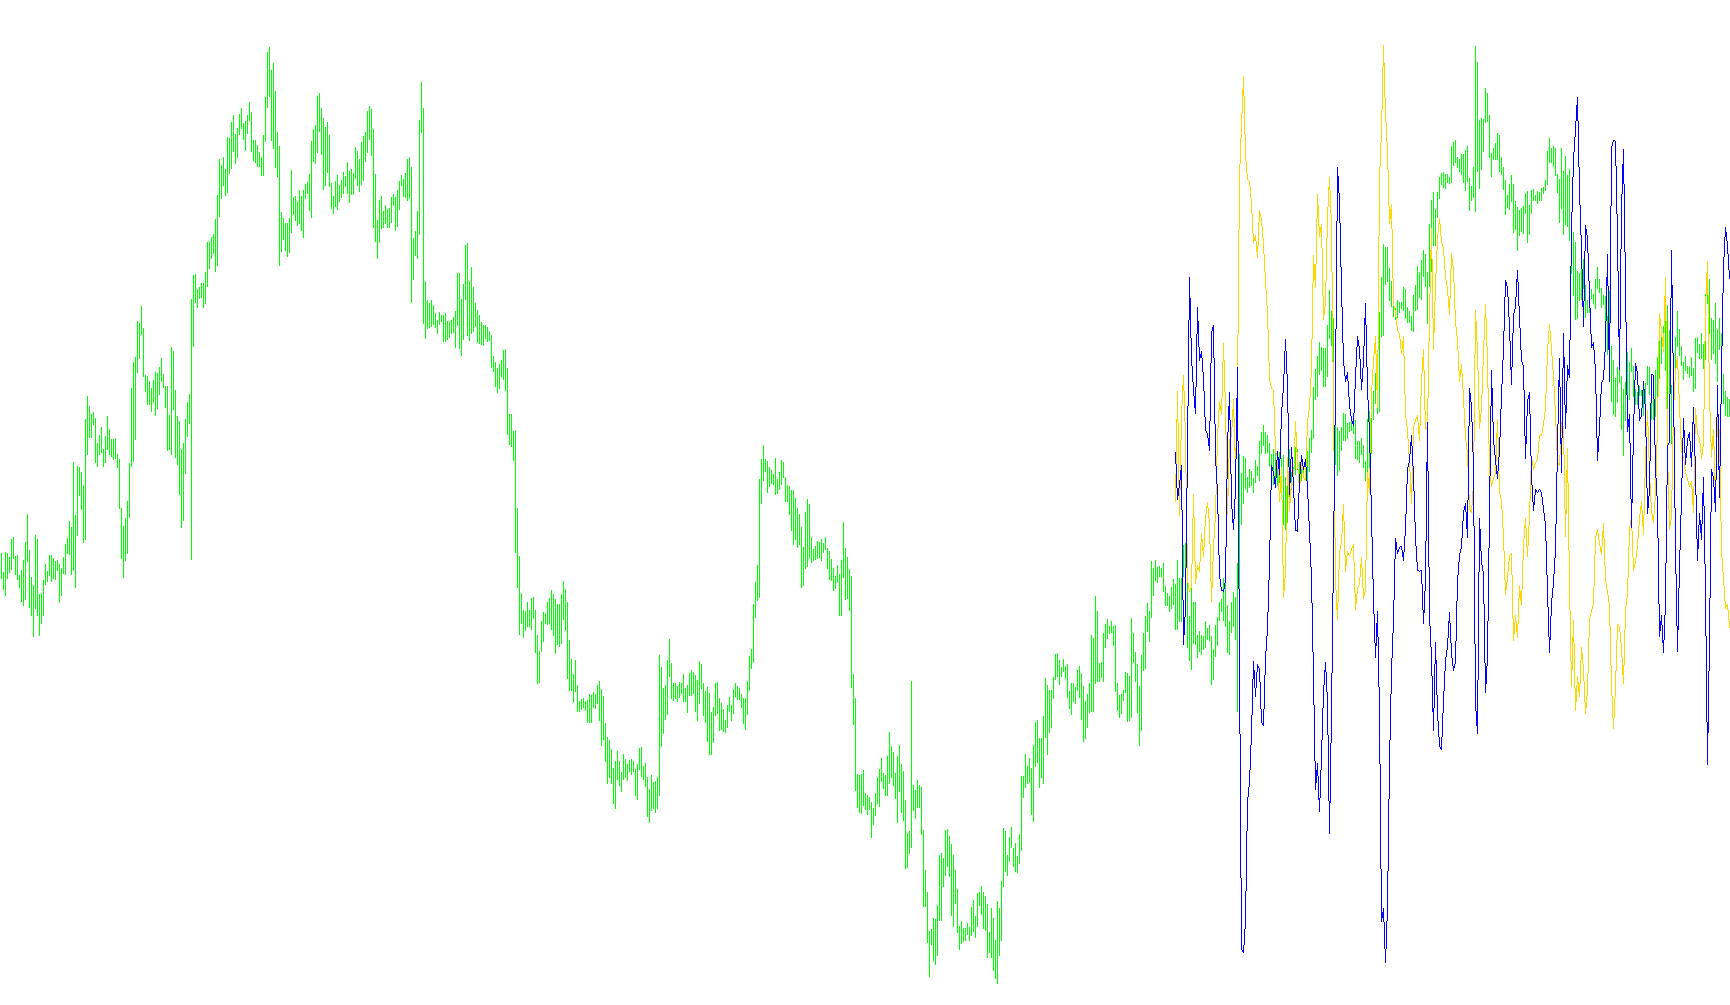
This script is designed to analyze market trends by calculating and visualizing two distinct data streams in a separate window on your trading platform. Its primary goal is to help traders distinguish between price action and underlying momentum by comparing standard band movements against power dynamics.
Core Functionality
The logic operates by processing historical price data (such as Close, Open, High, or Low prices) over a specific number of bars to generate two separate lines:
1. The Trend Baseline (Blue Line) This component measures the "distance" between the current market price and a moving band. Instead of just showing where the price is, it calculates the gap between the actual price and a calculated band (which can represent the main trend, the upper limit, or the lower limit). By subtracting the band value from the current price, the script highlights how far the market is deviating from its established "normal" range.
2. The Power Dynamics (Red Line) This component measures the combined strength of both "bullish" and "bearish" forces within the market. It calculates the "power" exerted by buyers and sellers over a set period and then inverts that value to create a visual representation of momentum. This allows you to see the intensity of the price movement regardless of its direction.
How it Works Together
The script takes several user-defined parameters into account to customize how these lines are drawn:
- Price Selection: You can choose which specific price point (like the High, Low, or a weighted average) the logic should focus on.
- Sensitivity: By adjusting periods and deviations, you can control how "smooth" or "reactive" the lines appear.
- Data Processing: The script looks back through your history to ensure that these calculations are consistent, providing a continuous flow of data from past candles to the current live price.
Summary for the Trader
Essentially, this tool provides a dual-view perspective: one line tells you where the price is relative to its trend boundary, and the other tells you how much strength (power) is currently behind that movement. When these two values interact, they provide a clearer picture of whether a trend is gaining momentum, exhausting itself, or deviating too far from its equilibrium.
//+------------------------------------------------------------------+
//|                                                        Trend.mq4 |
//|                                                                  |
//|                                        Ramdass - Conversion only |
//+------------------------------------------------------------------+

#property indicator_separate_window
#property indicator_buffers 2
#property indicator_color1 Blue
#property indicator_color2 Red
//---- input parameters
extern int Bands_Mode_0_2=0;  // =0-2 MODE_MAIN, MODE_LOW, MODE_HIGH
extern int Power_Price_0_6=0; // =0-6 PRICE_CLOSE,PRICE_OPEN,PRICE_HIGH,PRICE_LOW,PRICE_MEDIAN,PRICE_TYPICAL,PRICE_WEIGHTED
extern int Price_Type_0_3=0;  // =0-3 PRICE_CLOSE,PRICE_OPEN,PRICE_HIGH,PRICE_LOW
extern int Bands_Period=20;
extern int Bands_Deviation=2;
extern int Power_Period=13;
extern int CountBars=300;
//---- buffers
double value[];
double value2[];
//+------------------------------------------------------------------+
//| Custom indicator initialization function                         |
//+------------------------------------------------------------------+
int init()
  {
//   string short_name;
//---- indicator line
   IndicatorBuffers(2);
   SetIndexStyle(0,DRAW_LINE);
   SetIndexStyle(1,DRAW_LINE);
   SetIndexBuffer(0,value);
   SetIndexBuffer(1,value2);
//----

//----
   return(0);
  }
//+------------------------------------------------------------------+
//| Trend                                                         |
//+------------------------------------------------------------------+
int start()
  {
   SetIndexDrawBegin(0,Bars-CountBars+Bands_Period+1);
   SetIndexDrawBegin(1,Bars-CountBars+Bands_Period+1);
   int i,CurrentBar,Bands_Mode,counted_bars=IndicatorCounted();
   double Power_Price,CurrentPrice;
//----
   if(Bars<=Bands_Period) return(0);
//---- initial zero
   if(counted_bars<Bands_Period)
   {
      for(i=1;i<=Bands_Period;i++) value[Bars-i]=0.0;
      for(i=1;i<=Bands_Period;i++) value2[Bars-i]=0.0;
   }
//----
   i=CountBars-Bands_Period-1;
   if(counted_bars>=Bands_Period) i=CountBars-counted_bars-1;


if (Bands_Mode_0_2==1) Bands_Mode=MODE_LOW;
if (Bands_Mode_0_2==2) Bands_Mode=MODE_HIGH;
if (Bands_Mode_0_2==0) Bands_Mode=MODE_MAIN;

if (Power_Price_0_6==1) Power_Price=PRICE_OPEN;
if (Power_Price_0_6==2) Power_Price=PRICE_HIGH;
if (Power_Price_0_6==3) Power_Price=PRICE_LOW;
if (Power_Price_0_6==4) Power_Price=PRICE_MEDIAN;
if (Power_Price_0_6==5) Power_Price=PRICE_TYPICAL;
if (Power_Price_0_6==6) Power_Price=PRICE_WEIGHTED;
if (Power_Price_0_6==6) Power_Price=PRICE_CLOSE;

for (i=CountBars-1; i>=0; i--)
{
  if (Price_Type_0_3==1) CurrentPrice=Open[i];

  if (Price_Type_0_3==2) CurrentPrice=High[i];

  if (Price_Type_0_3==3) CurrentPrice=Low[i];
  if (Price_Type_0_3==0) CurrentPrice=Close[i];

  value[i]=CurrentPrice-iBands(NULL,0,Bands_Period,Bands_Deviation,0,Bands_Mode,Power_Price,i);
  value2[i]=-(iBearsPower(NULL,0,Power_Period,Power_Price,i)+iBullsPower(NULL,0,Power_Period,Power_Price,i));

}


   return(0);
  }
//+------------------------------------------------------------------+
Comments