Indicator

EventsExpert

EVWMA
Indicator

EVWMA

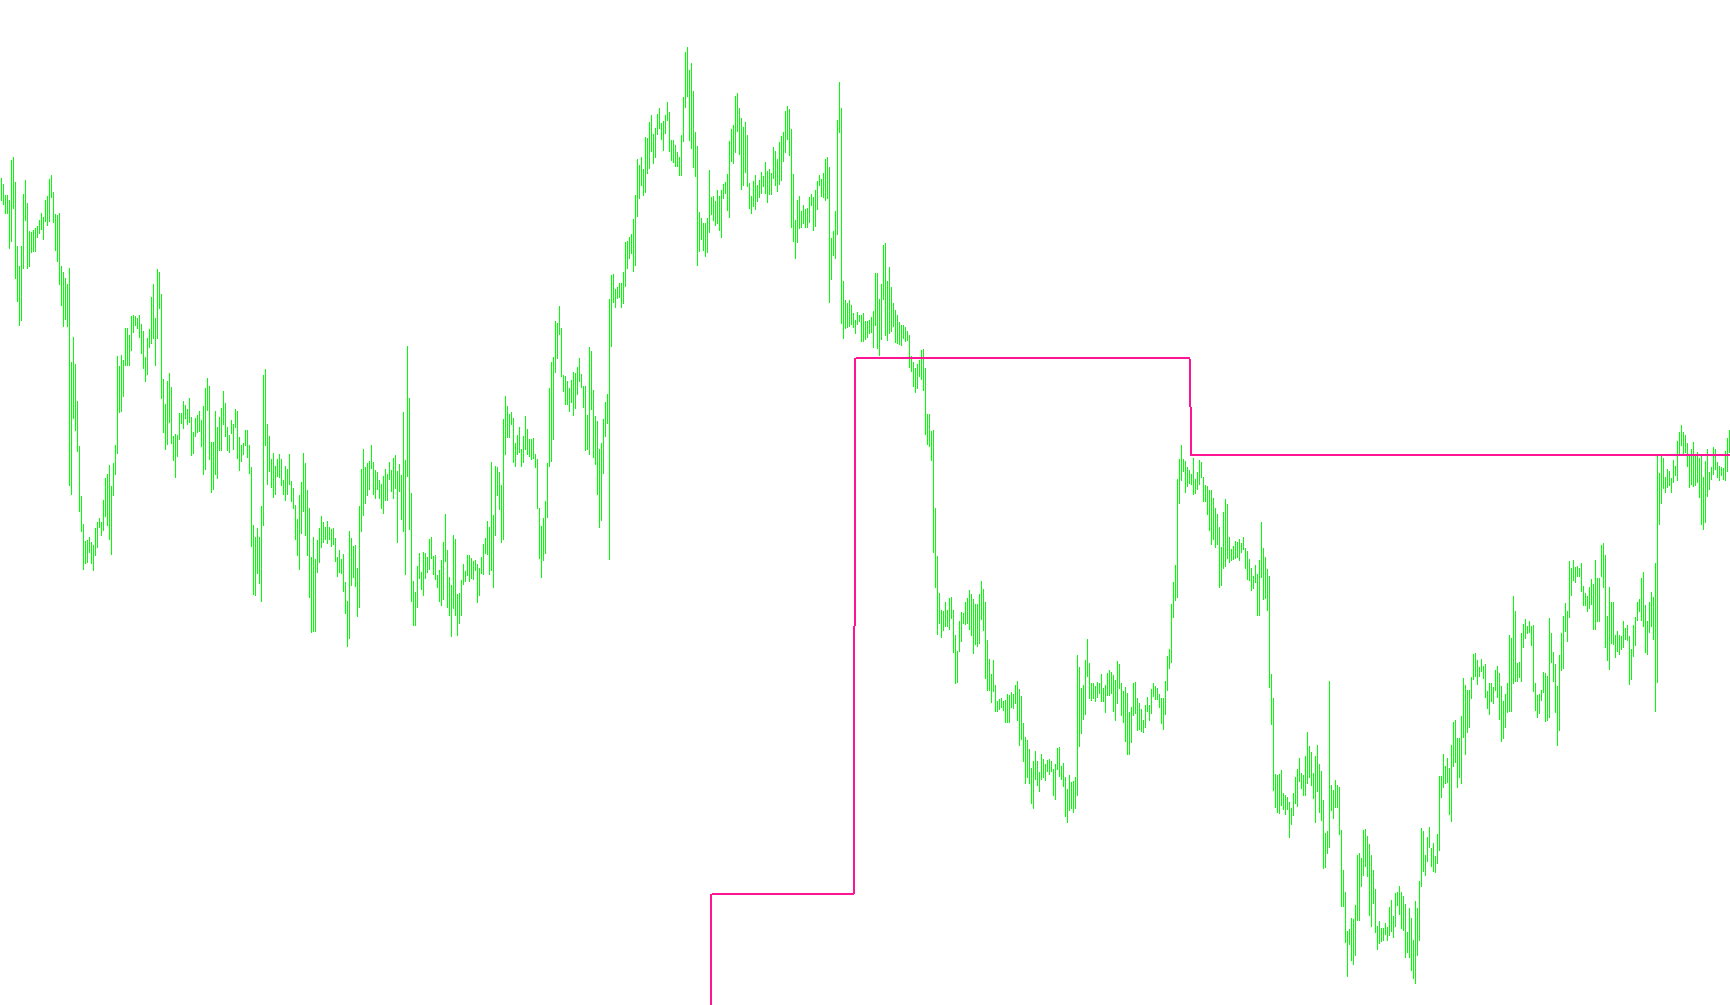
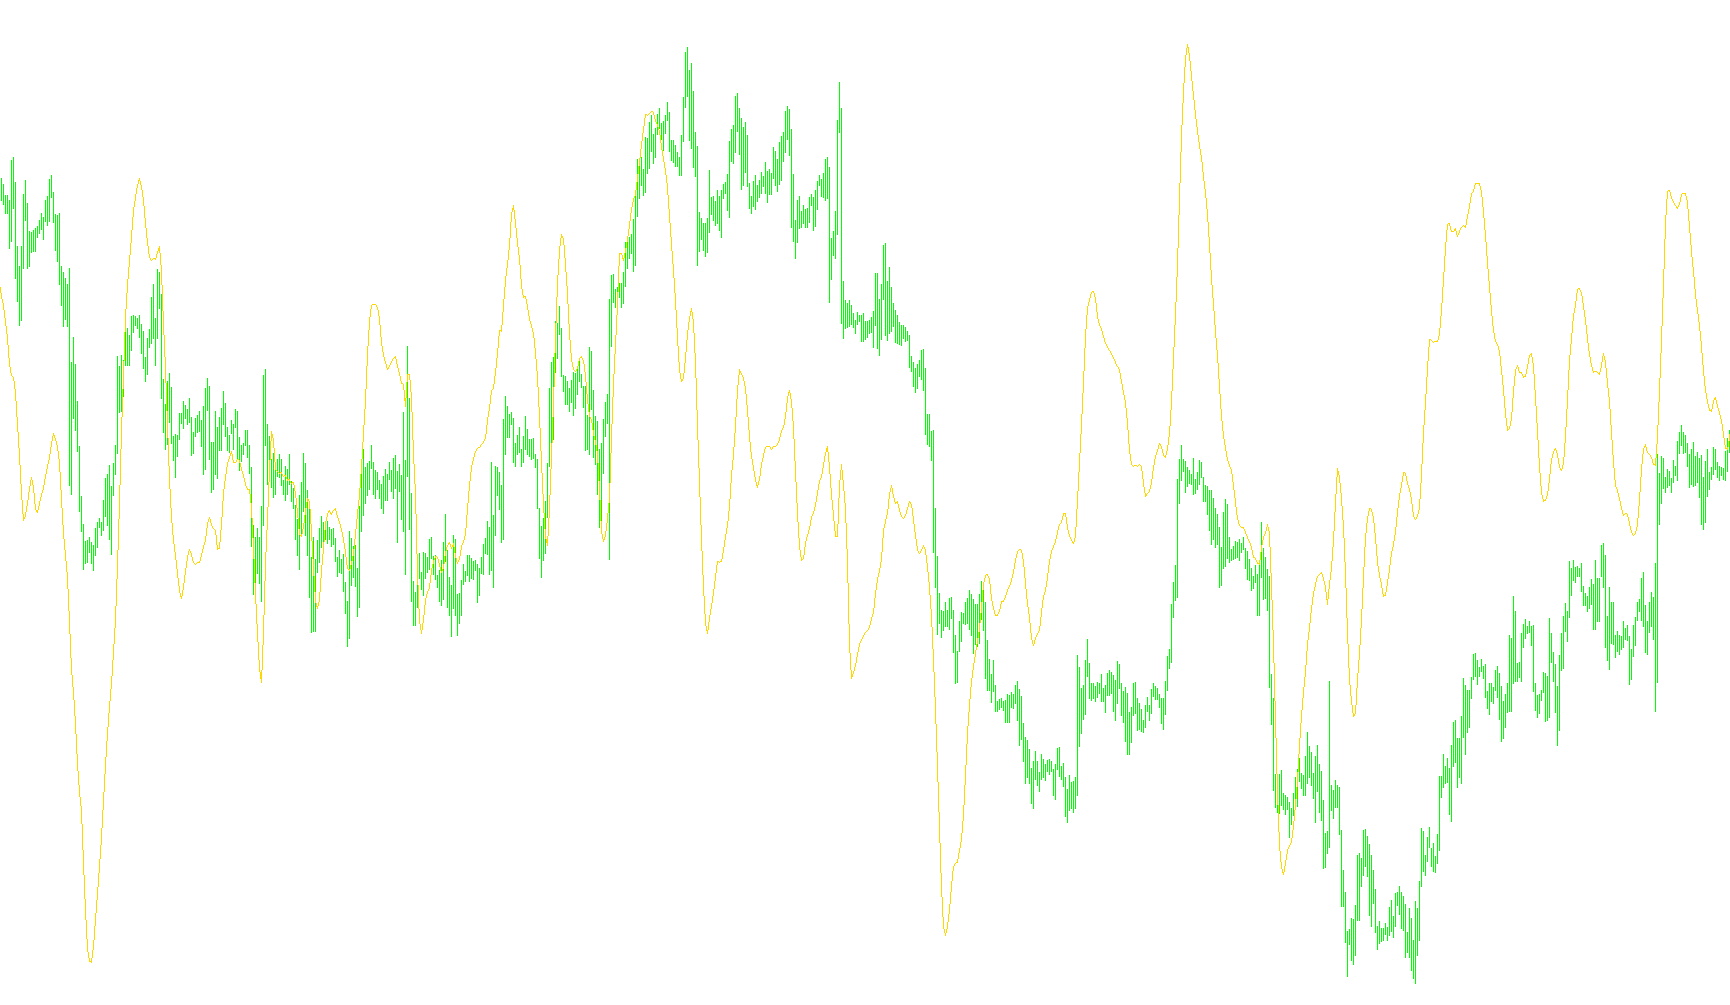
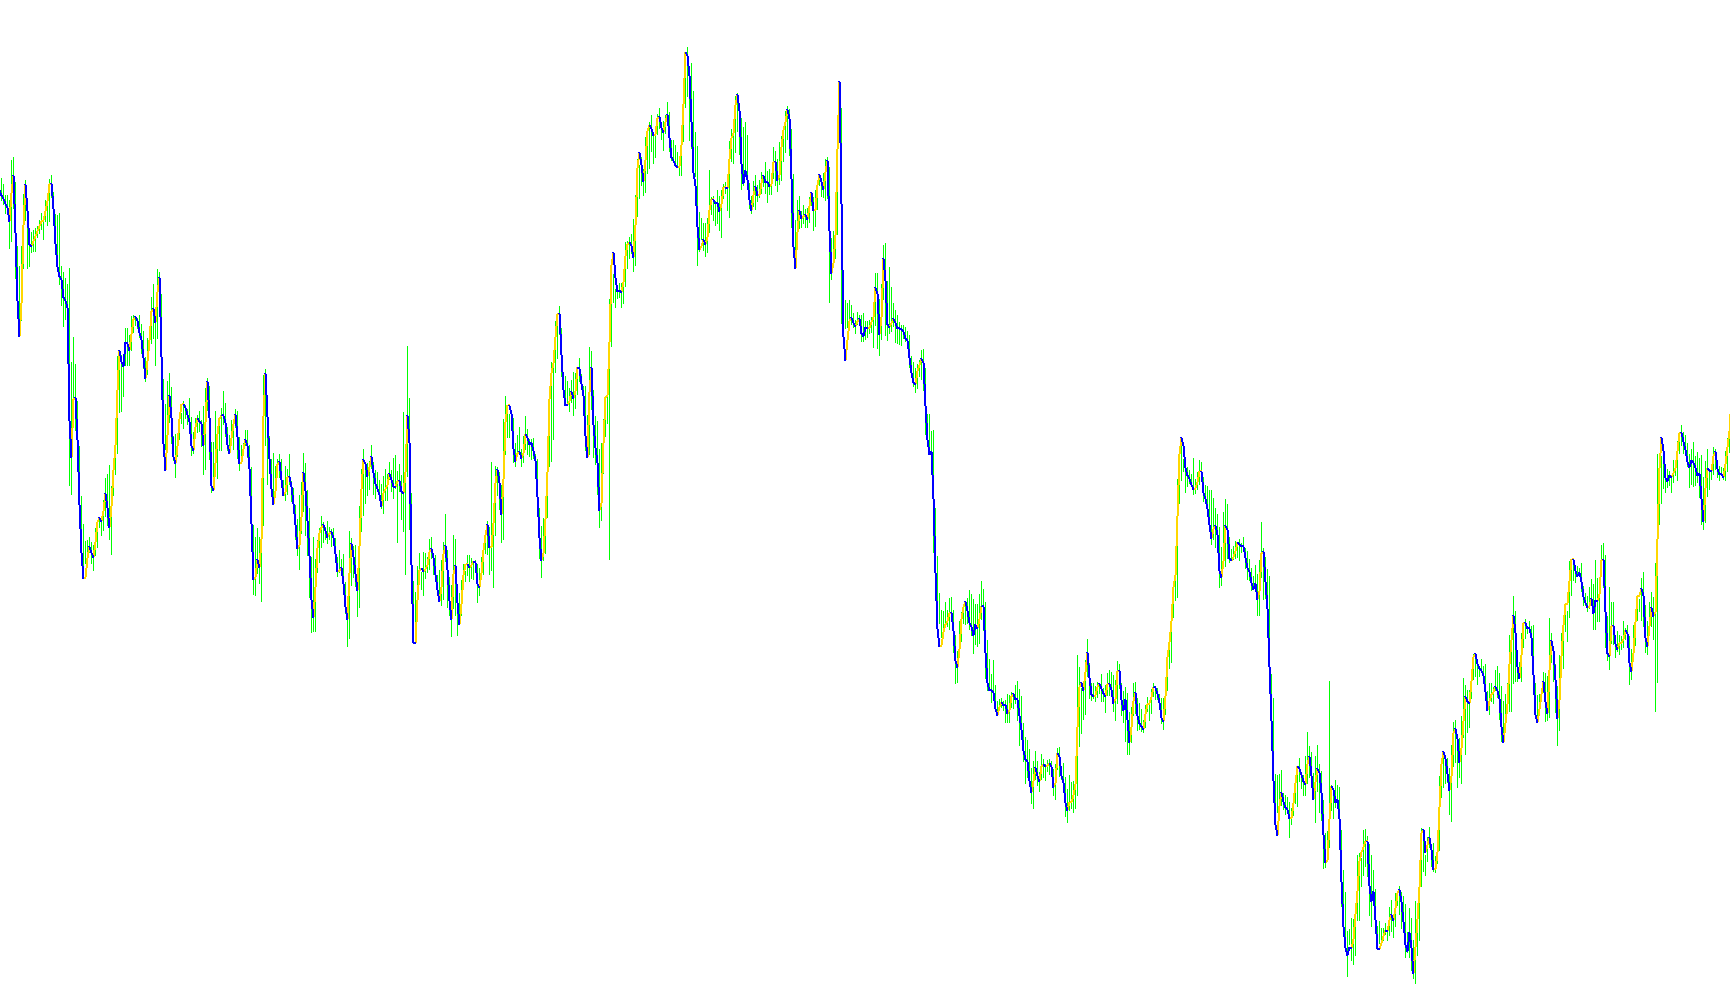
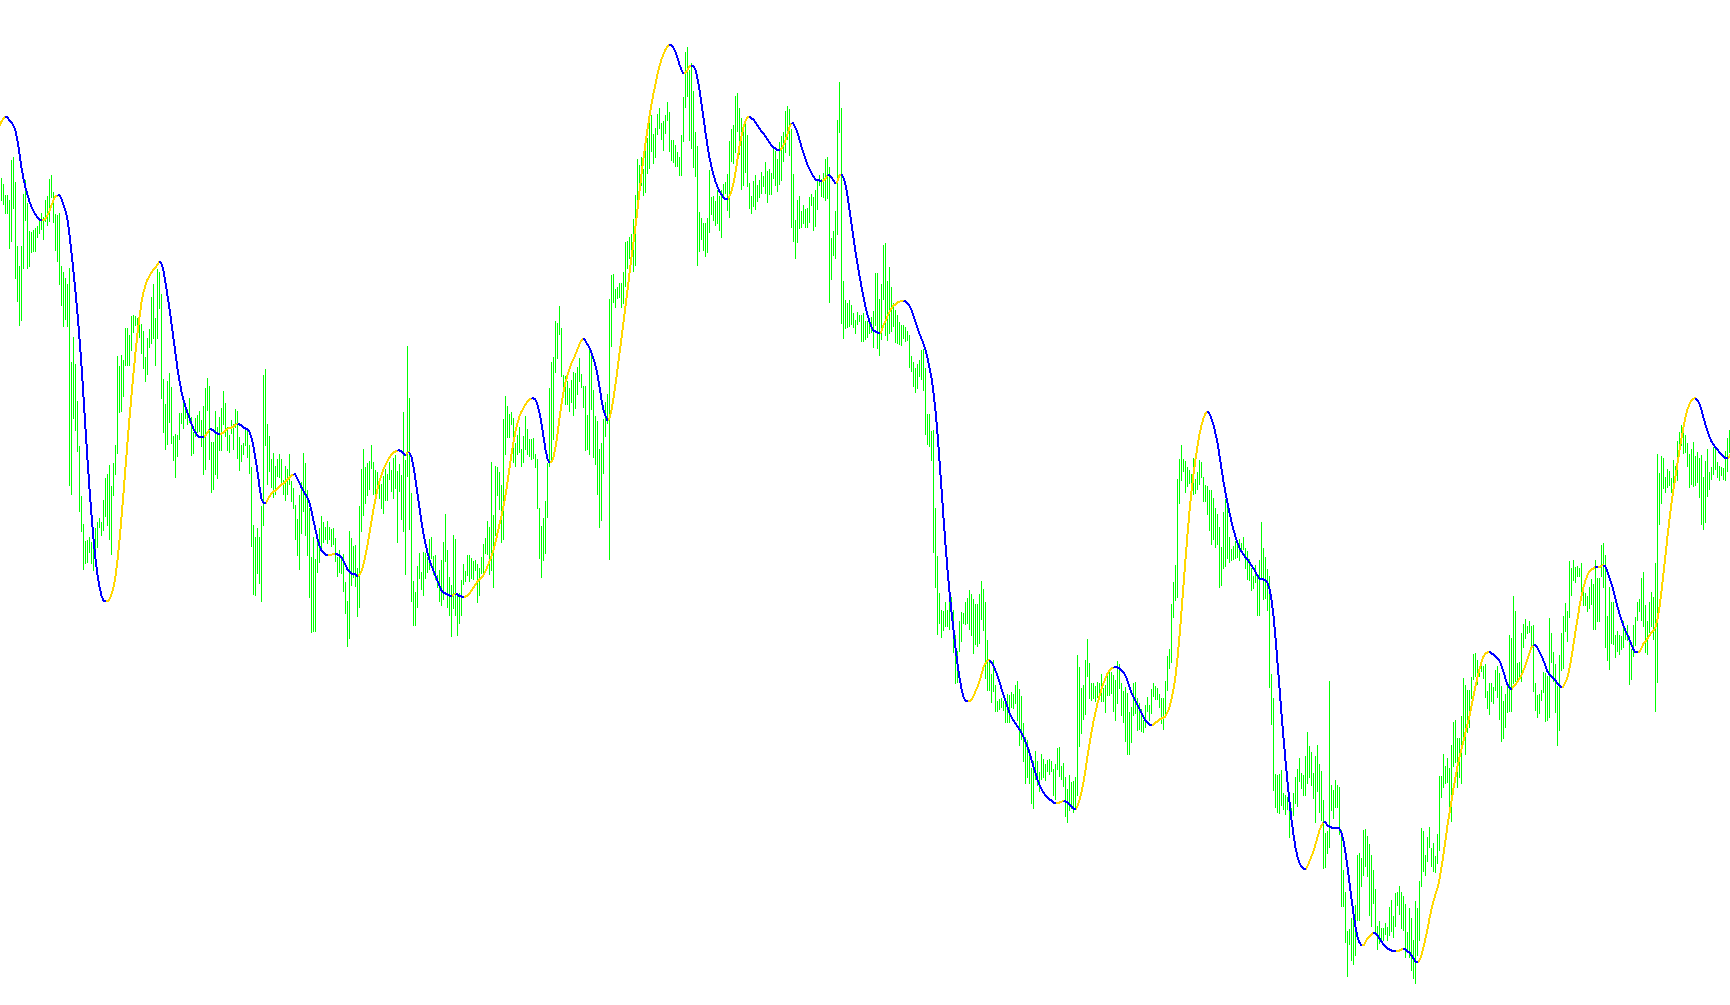
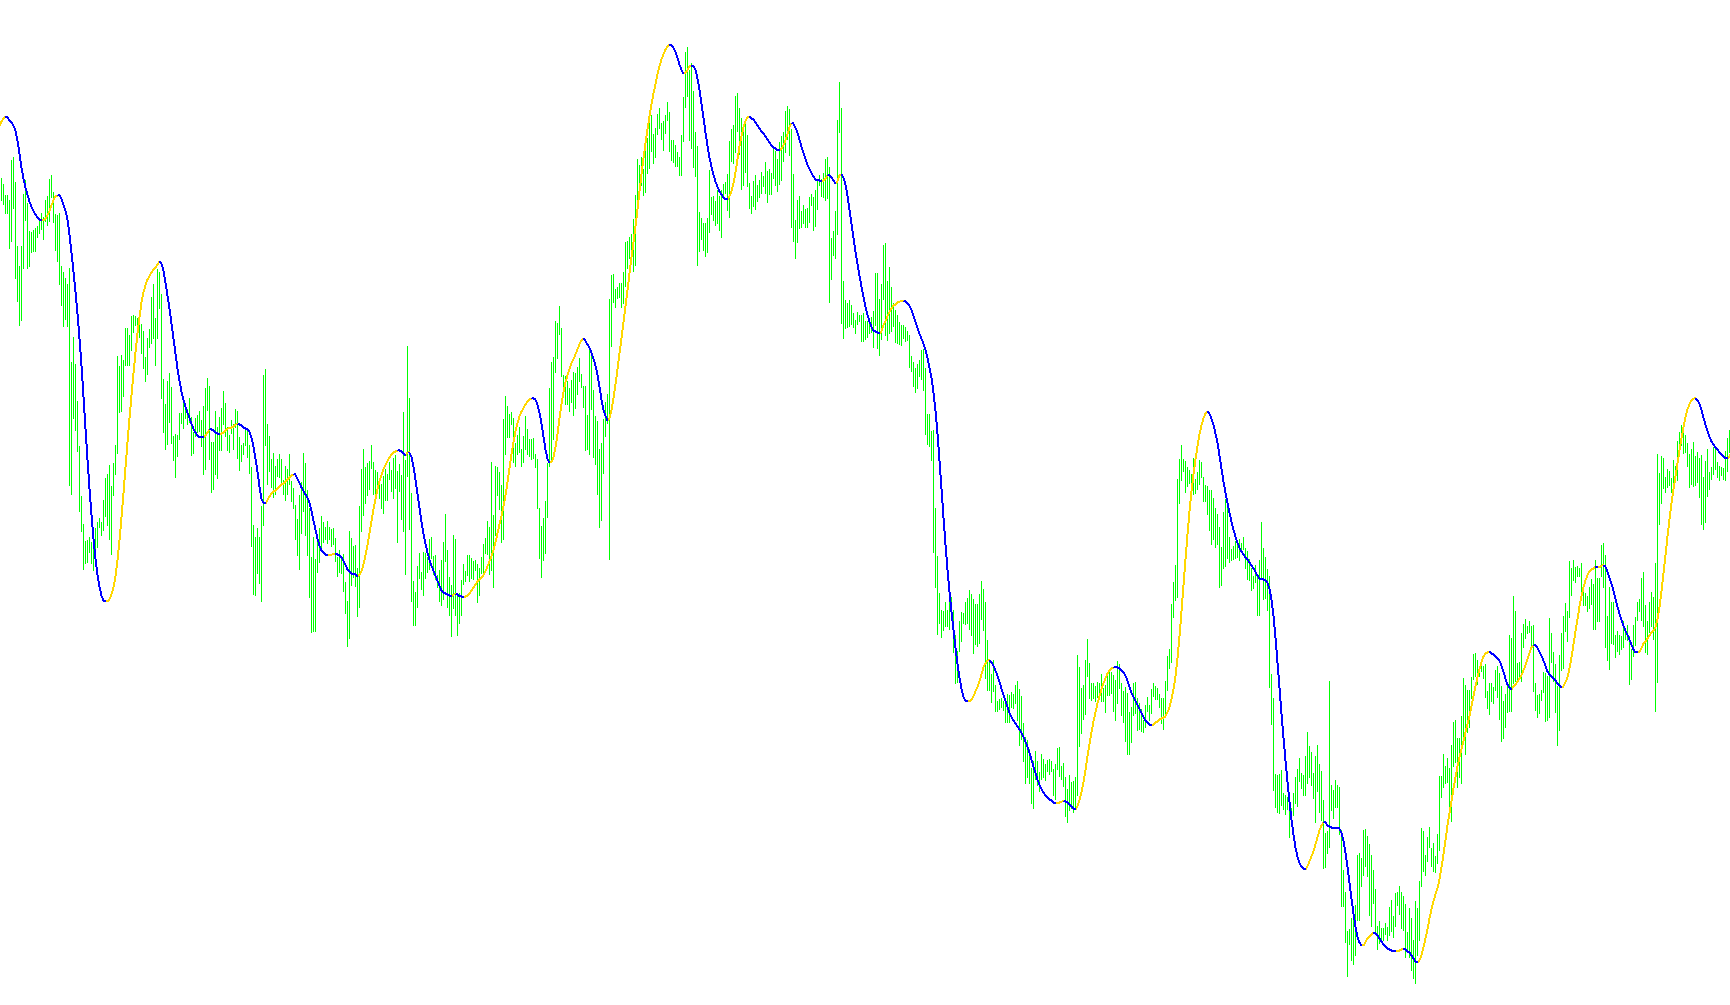
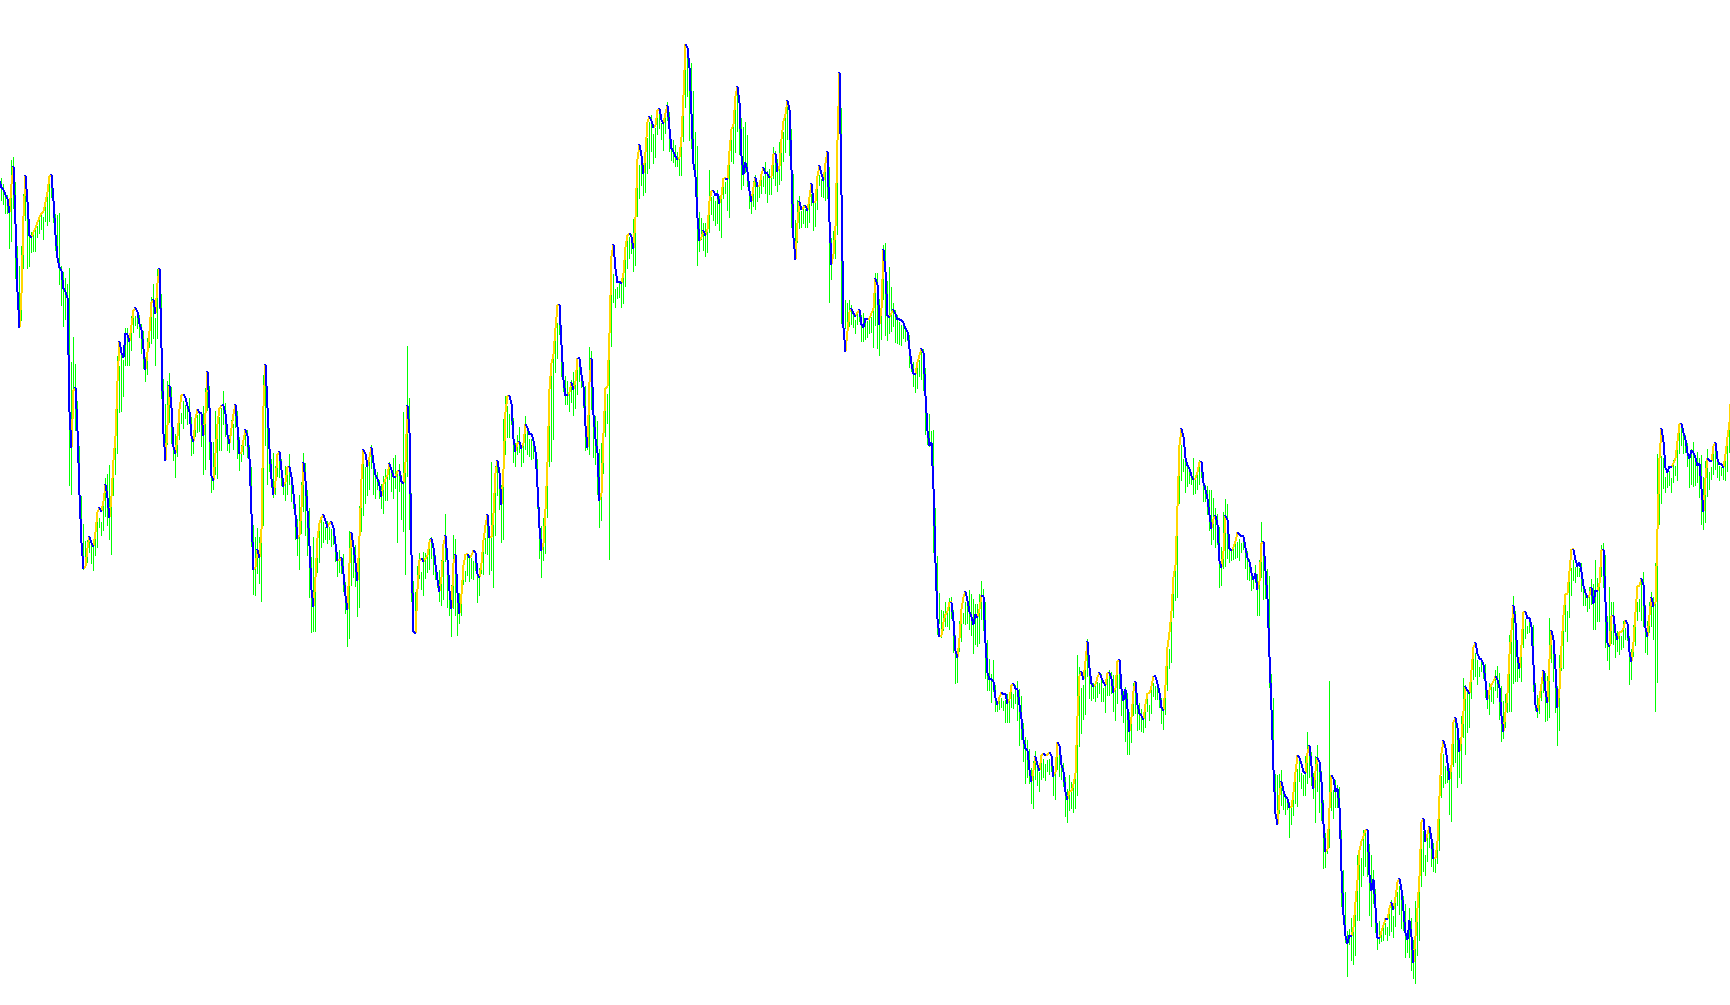
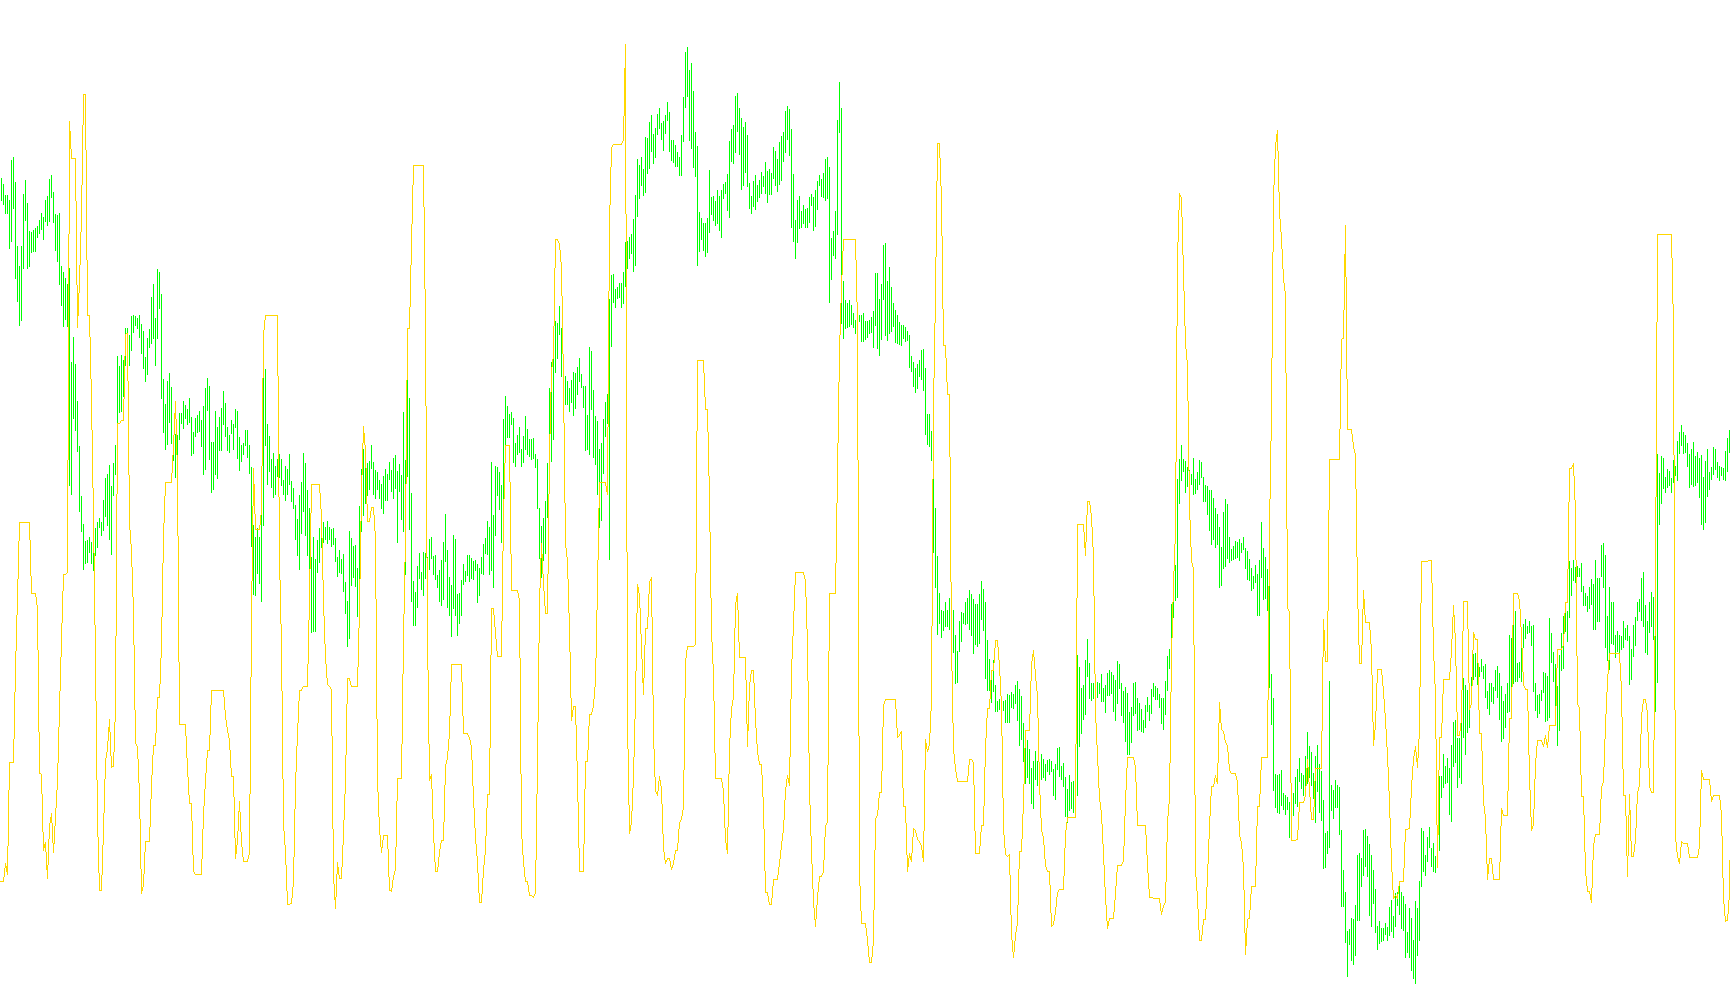
Calculates a price moving average where the weighting coefficient dynamically adjusts based on the ratio between actual market volume and a user-defined threshold.

EVWMA_v1
Indicator

EVWMA_v1

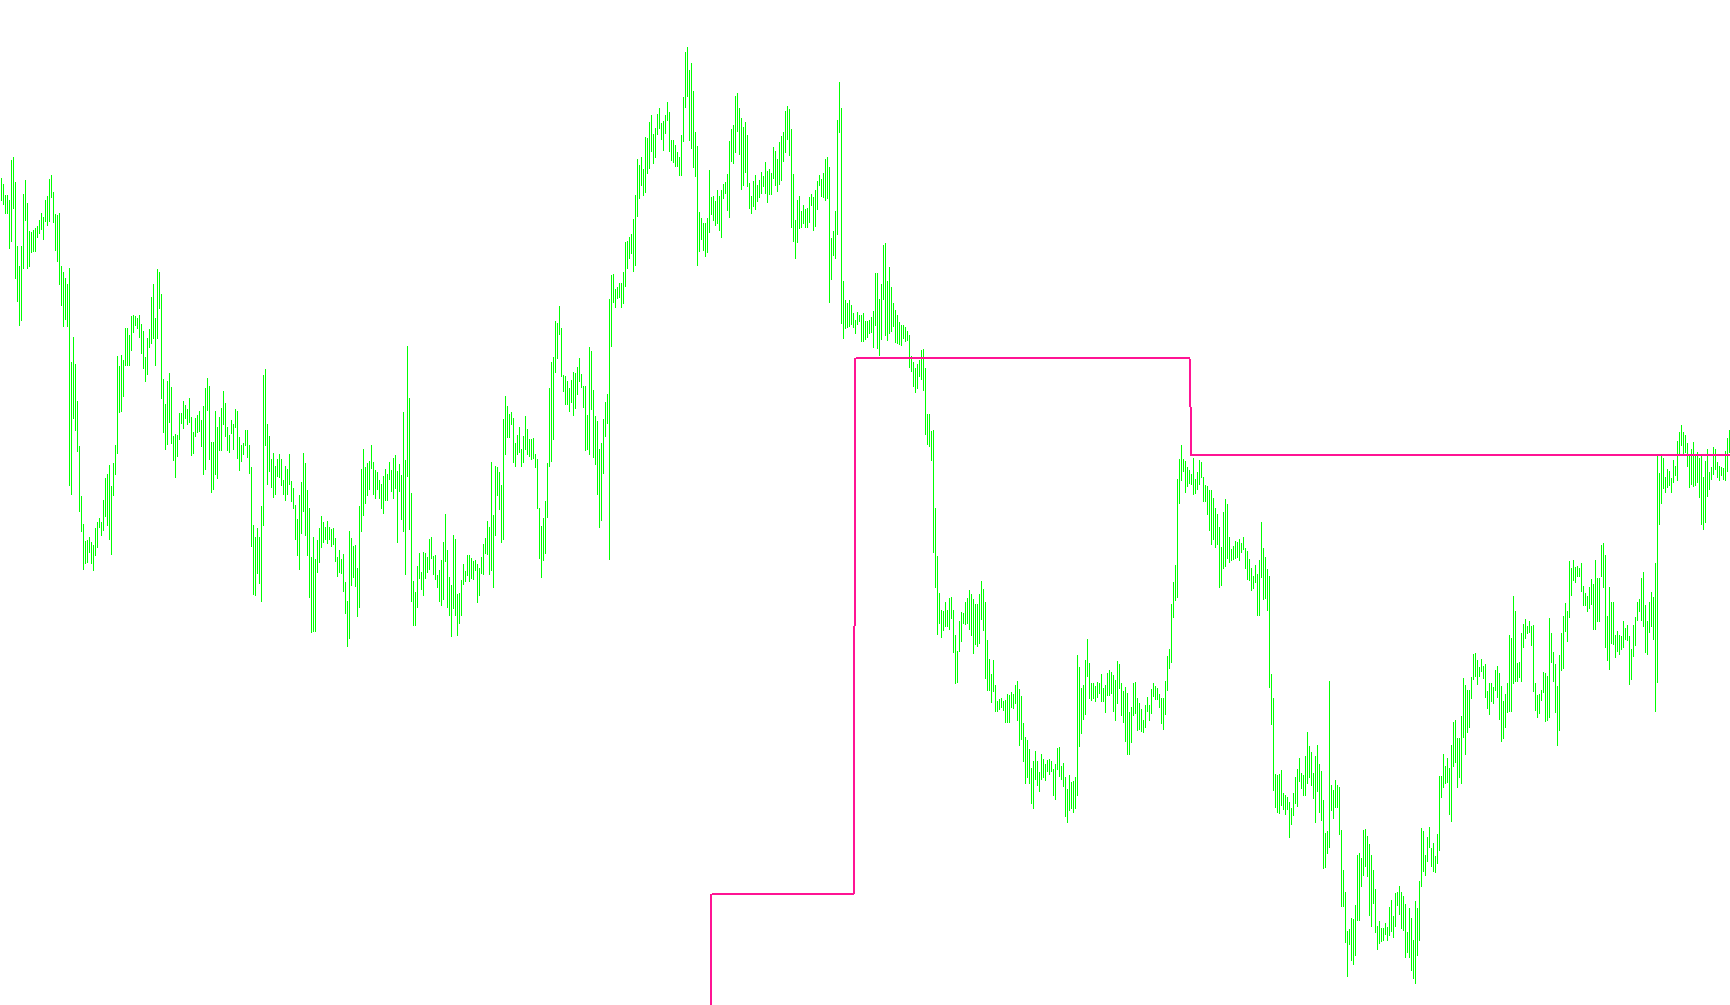
This indicator calculates a weighted moving average that dynamically adjusts its smoothing intensity based on relative volume throughput and a customizable threshold violation logic.

EVWMA_v2
Indicator

EVWMA_v2

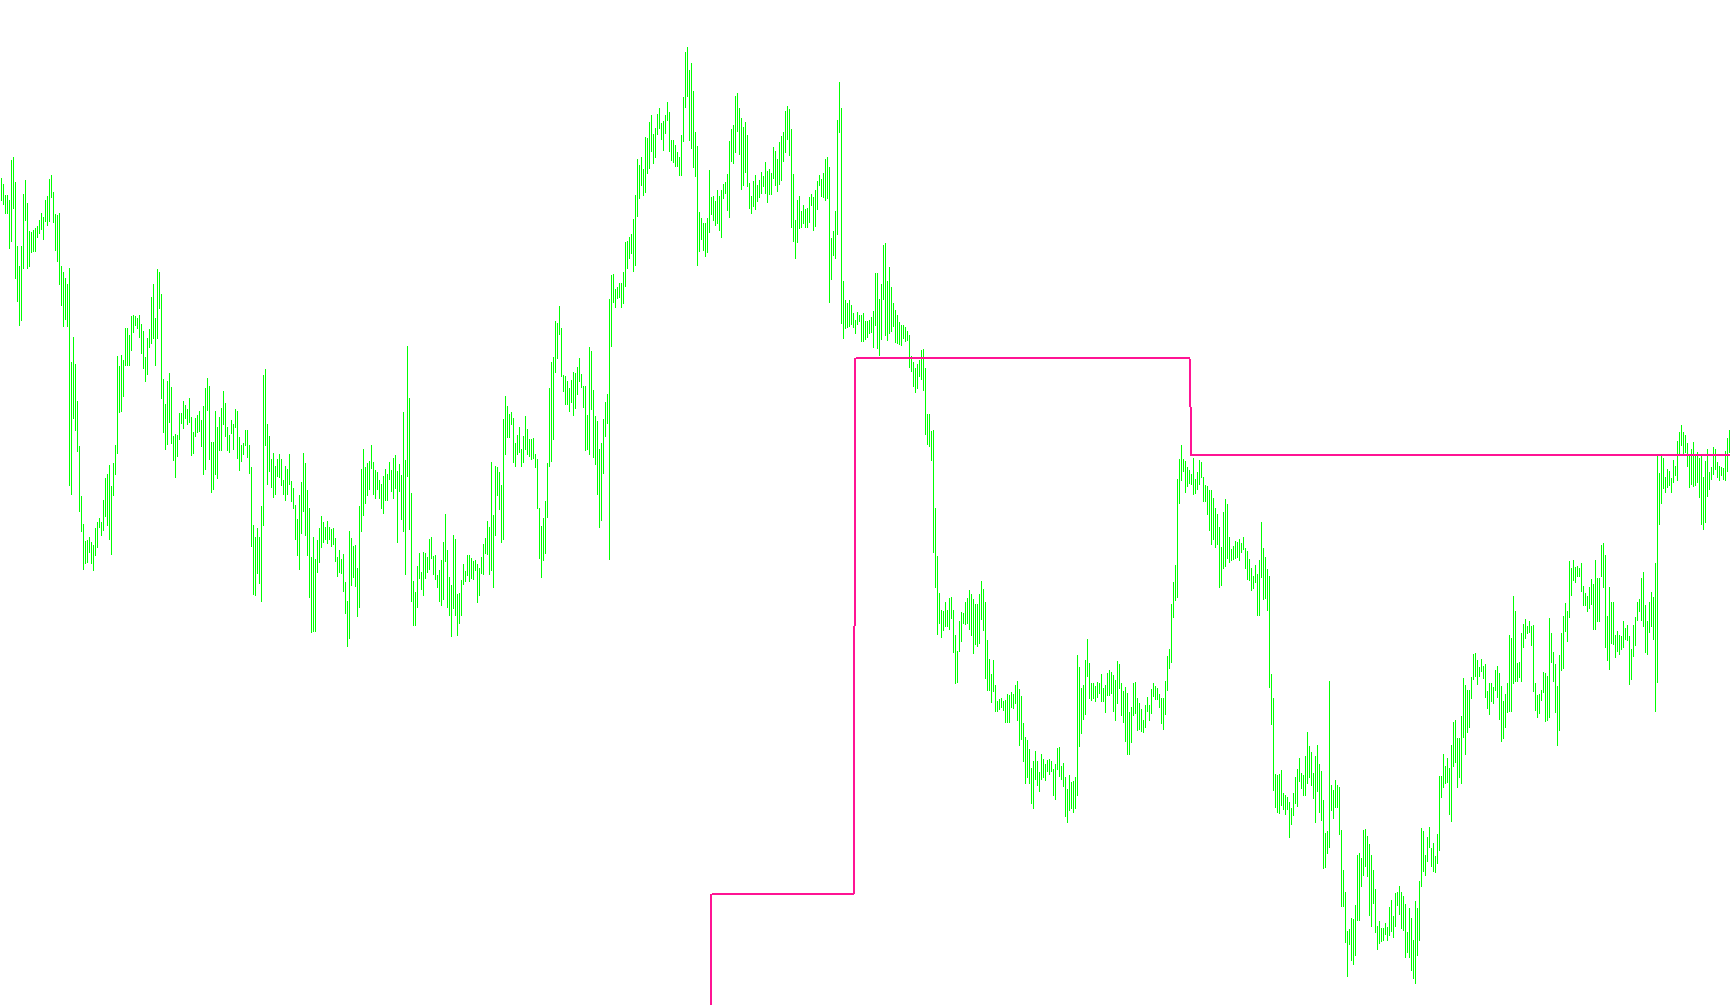
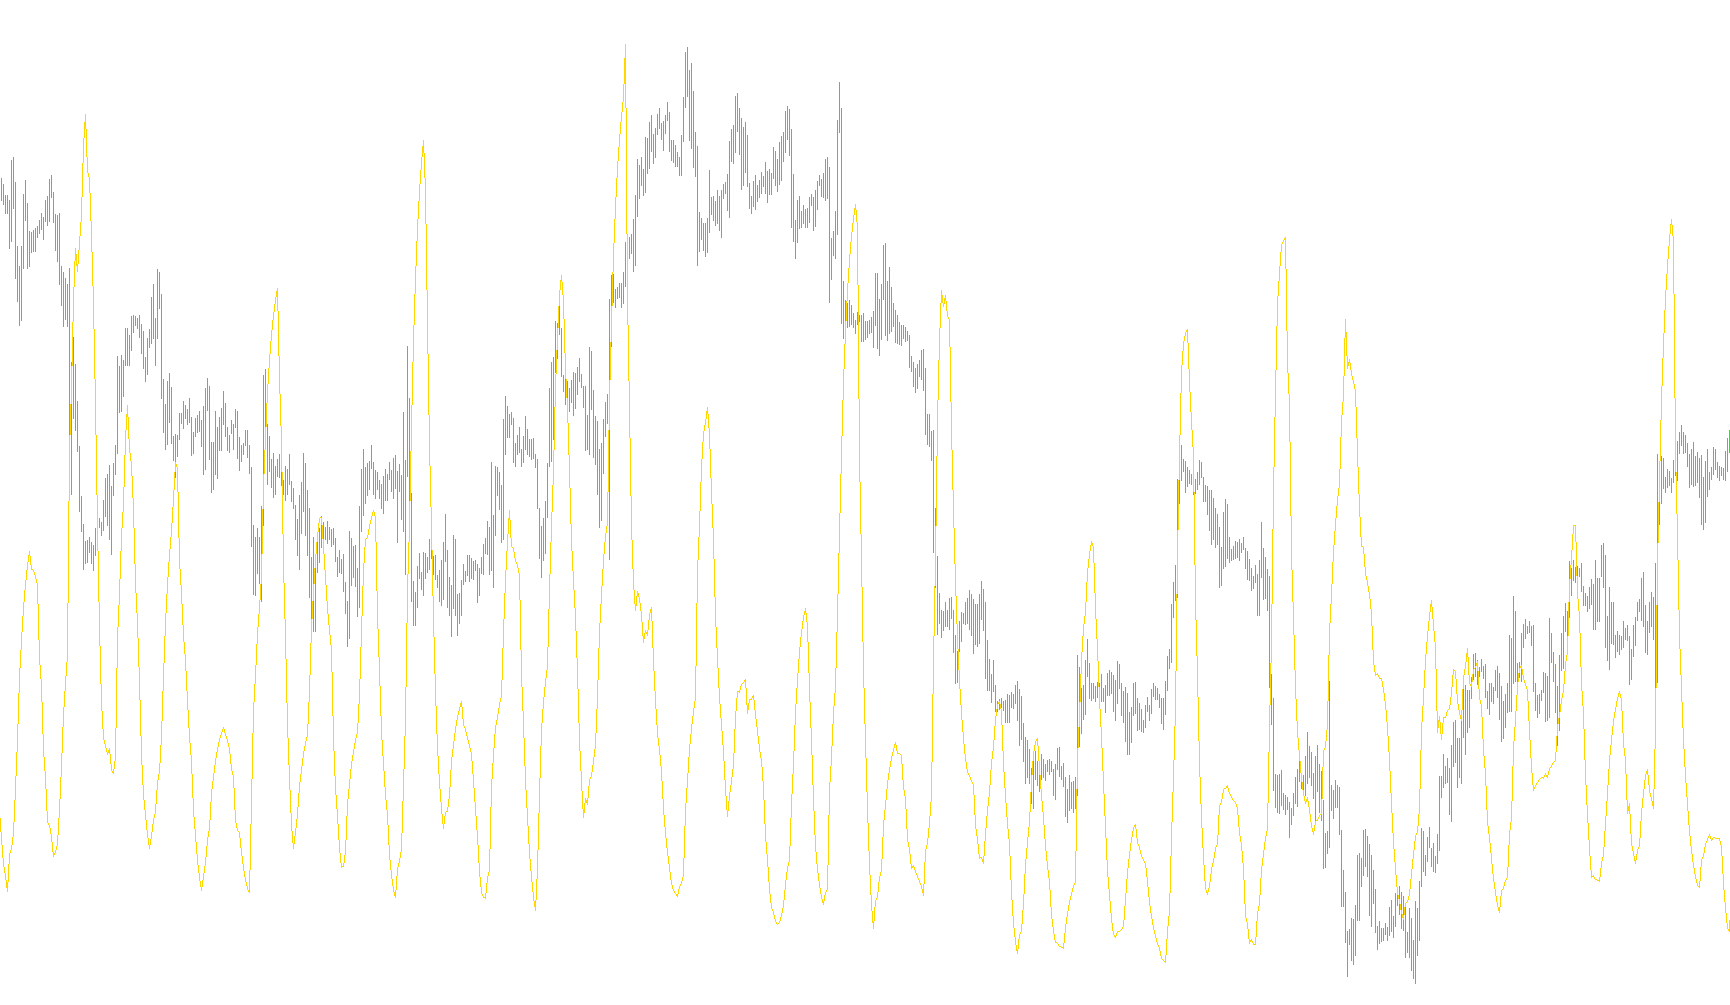
This indicator calculates a responsive moving average that dynamically adjusts its weighting based on the deviation between current trade volume and a user-defined threshold.

ew1
Indicator

ew1

iMA

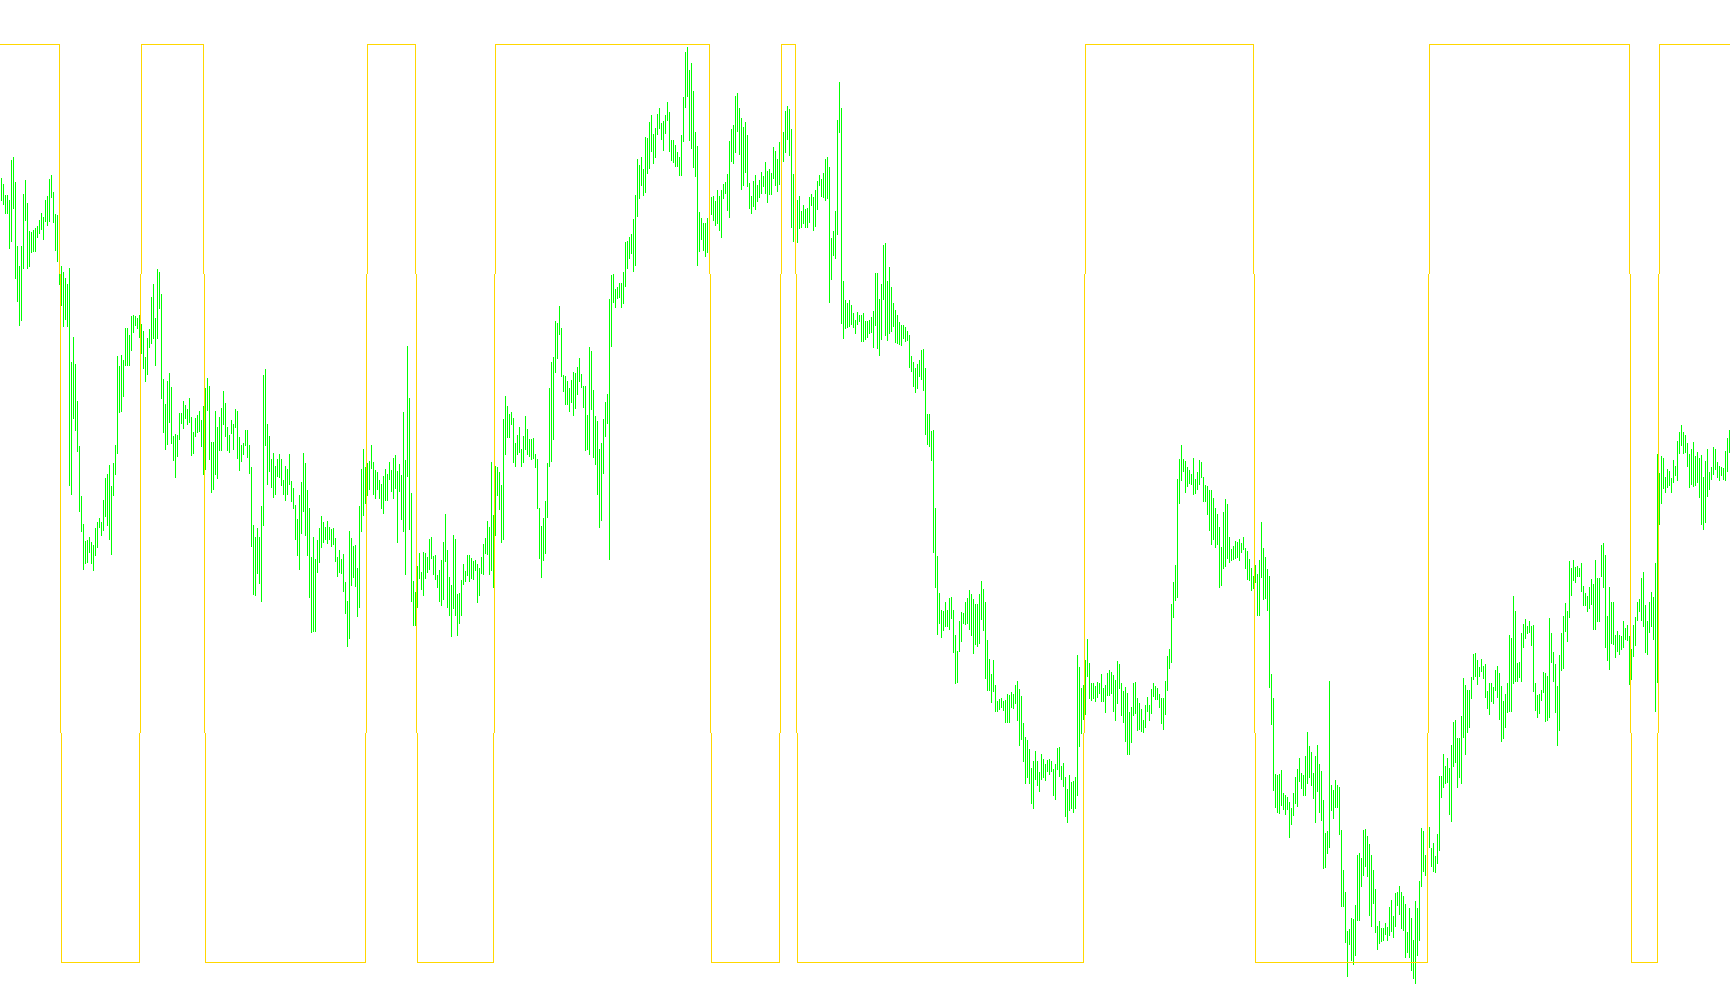
This indicator identifies trend reversals by calculating the relative extrema of the difference between fast and slow Simple Moving Averages based on median price.

ew1_v1
Indicator

ew1_v1

iMA

This indicator identifies directional shifts by comparing the current spread of short-term and long-term median moving averages against a defined historical peak-to-valley threshold.

EWO
Indicator

EWO

iMA

This indicator quantifies trend momentum by calculating the numerical spread between a short-term 5-period and a long-term 35-period Simple Moving Average based on median prices.

EWOCCI_Indicator.2
Indicator

EWOCCI_Indicator.2

iCCIiMA

This indicator generates buy/sell signals based on the crossover of the CCI around zero and the sign of the Elliot Wave Oscillator (EWO), signaling potential trend changes.

EWOCCI_Indicator.2_v1
Indicator

EWOCCI_Indicator.2_v1

iCCIiMA

This indicator identifies high-probability trend reversals by detecting concurrent momentum shifts between the Elliot Wave Oscillator (EWO) and the Commodity Channel Index (CCI) filtered by daily price pivots.

EWOCCI_Indicator
Indicator

EWOCCI_Indicator

iCCIiMA

This indicator identifies trend reversals by detecting simultaneous zero-crossings in the Commodity Channel Index and the Elliot Wave Oscillator while filtering for momentum via moving average spreads.

EWOCCI_Indicator_v1
Indicator

EWOCCI_Indicator_v1

iCCIiMA

This indicator identifies potential reversals by detecting simultaneous zero-crossings of the Commodity Channel Index (CCI) and the Elliot Wave Oscillator (EWO), filtered by momentum divergence.

ExAccount
Indicator

ExAccount

This script parses StrategyTester.htm files to extract historical trade data and renders visual markers for entries, exits, and modifications directly on the chart.

Example
Indicator

Example

This indicator calculates and displays the absolute price fluctuations in points across multiple currency pairs simultaneously over H1, H4, and D1 timeframes.

Indicator

ExamplePNN

ExCandles
Indicator

ExCandles

This indicator identifies and plots specific multi-candle patterns, including reversal stars, engulfing structures, and high-momentum wick formations, to highlight potential trend shifts.

ExCandles2
Indicator

ExCandles2

A comprehensive candlestick pattern recognition system that identifies complex reversal and continuation formations—including engulfing, doji stars, and harami figures—while optionally validating signals against a cumulative trend bias.

Exec1
Indicator

Exec1

This script leverages DLL imports to trigger and execute external batch files from a specific local directory path upon execution.

Execute Line Build 205 Ok
Indicator

Execute Line Build 205 Ok

iMAiMAOnArray

This indicator identifies directional momentum by applying a secondary moving average over a Hull Moving Average derived vector to highlight distinct bullish and bearish trend segments.

Execute Line
Indicator

Execute Line

iMAiMAOnArray

This indicator calculates a Hull Moving Average to identify momentum shifts and visualize distinct directional trend transitions through price velocity smoothing.

Execute Linesw Alert
Indicator

Execute Linesw Alert

iMAiMAOnArray

This indicator calculates the momentum differential between two weighted moving averages of varying lengths to identify structural trend shifts and price velocity.

Execute Linesw Alert_001
Indicator

Execute Linesw Alert_001

iMAiMAOnArray

This indicator identifies directional shifts by calculating a smoothed differential between two weighted moving averages to isolate underlying momentum trends.

Execute Linesw-1(Alert)
Indicator

Execute Linesw-1(Alert)

iMAiMAOnArray

This indicator calculates a secondary vector derived from the differential of two weighted moving averages to identify trend shifts and signal momentum reversals.

Execute Linesw-1(Alert)_001
Indicator

Execute Linesw-1(Alert)_001

iMAiMAOnArray

This indicator calculates a synthetic momentum vector by subtracting long-period weighted moving averages from doubled short-period averages, then applies a secondary smoothing pass to isolate trend reversals.

Execute Linesw
Indicator

Execute Linesw

iMAiMAOnArray

This indicator calculates a synthetic vector by subtracting long-period weighted moving averages from twice the short-period values to identify directional shifts and trend transitions.

Execute Linesw_001
Indicator

Execute Linesw_001

iMAiMAOnArray

This indicator identifies directional shifts by applying a square root smoothing algorithm to the differential of dual weighted moving averages.

exercise2
Indicator

exercise2

This script continuously scans the chart to detect and count active arrow objects whenever the visible bar range changes.

ExMass
Indicator

ExMass

This indicator quantifies the absolute range between the highest high and lowest low within a rolling window to measure historical price variance.

ExMass_v2
Indicator

ExMass_v2

The algorithm quantifies price expansion by calculating the product of high-low extremes within a rolling window, smoothed by a normalized cumulative buffer.

exoticwave
Indicator

exoticwave

The script systematically extracts and serializes historical price action, volume, and temporal metadata into a localized CSV file for external analysis.

exoticwavein
Indicator

exoticwavein

This script iterates through historical price action and systematically exports OHLCV data into period-specific CSV files based on the current timeframe.

exoticwavein_v1
Indicator

exoticwavein_v1

This script systematically extracts historical price and volume data from the current chart into timestamp-organized CSV files based on specific timeframes.

exoticwave_v1
Indicator

exoticwave_v1

This script iterates through a specified range of historical price bars to generate a structured CSV file containing timestamp, price action, and volume data.

Exp - Convertor
Indicator

Exp - Convertor

This script parses historical price data and real-time ticks to synthesize multi-timeframe OHLCV records into a binary file format.

Exp-Close-----ALLORDERS----
Indicator

Exp-Close-----ALLORDERS----

This script iterates through active market positions to execute immediate closure based on global or symbol-specific filters.

Exp-Close-----ALLSTOP------
Indicator

Exp-Close-----ALLSTOP------

Automatically identifies and removes all active buy stop and sell stop orders across specified symbols or the current chart.

Exp-Close-----BUY------------
Indicator

Exp-Close-----BUY------------

Automates the immediate termination of all active long positions across either the entire brokerage or specific currency pairs based on user configuration.

Exp-Close-----BUYStop-------
Indicator

Exp-Close-----BUYStop-------

This script systematically identifies and eliminates all active pending buy stop orders across the entire brokerage account or a specific currency pair.

Exp-Close-----LOOSE---------
Indicator

Exp-Close-----LOOSE---------

This script iterates through active market positions to identify and execute immediate closures on all trades currently exhibiting a negative floating profit.

Exp-Close-----LOOSE--BUY---
Indicator

Exp-Close-----LOOSE--BUY---

This script automatically identifies and terminates open buy positions that are currently in a loss state across all symbols or a specific chart pair.

Exp-Close-----LOOSE--SELL---
Indicator

Exp-Close-----LOOSE--SELL---

This script automatically identifies and closes open sell positions that are currently in a loss state across specified symbols.

Exp-Close-----PROFIT---------
Indicator

Exp-Close-----PROFIT---------

This script automates the immediate execution of close orders for all assets or specific symbols once they reach a non-negative profit status.

Exp-Close-----PROFIT--BUY---
Indicator

Exp-Close-----PROFIT--BUY---

This script scans active market positions and automatically terminates all buy orders that have reached a non-negative profit state across all symbols or specific currency pairs.

Exp-Close-----PROFIT-SELL---
Indicator

Exp-Close-----PROFIT-SELL---

This script scans open positions to automatically execute market closures for all sell orders currently yielding a non-negative profit.

Exp-Close-----SelectType-----
Indicator

Exp-Close-----SelectType-----

A comprehensive utility script designed to filter and execute batch closures or deletions of active market positions and pending orders based on direction, profitability, or specific order types.

Exp-Close-----SELL------------
Indicator

Exp-Close-----SELL------------

Automatically identifies and executes market closure for all active sell positions across specified symbols based on current tick updates.

Exp-Close-----SELLStop-------
Indicator

Exp-Close-----SELLStop-------

This script automates the identification and removal of pending sell stop orders across all symbols or specific current assets.

Exp-CloseIfProfitAndLoss12062009
Indicator

Exp-CloseIfProfitAndLoss12062009

This script monitors real-time floating profits and losses to execute a bulk liquidation of all open positions once predefined monetary targets or specific account percentage milestones are achieved.

Exp-Rami-Stop
Indicator

Exp-Rami-Stop

This algorithm dynamically updates stop-loss positions across four progressive price thresholds to lock in profits as market volatility expands from the entry point.
Exp-StatusBar v29.08.09
Indicator

Exp-StatusBar v29.08.09

This indicator provides a comprehensive real-time visual dashboard displaying account statistics, multi-currency lot positions, price trends across multiple timeframes, and dynamic session tracking.
Expected Volumes
Indicator

Expected Volumes

Calculates the arithmetic average of volume data by aggregating historical ticks across specific hourly intervals to identify baseline liquidity expectations.