EWOCCI_Indicator_v1
Download script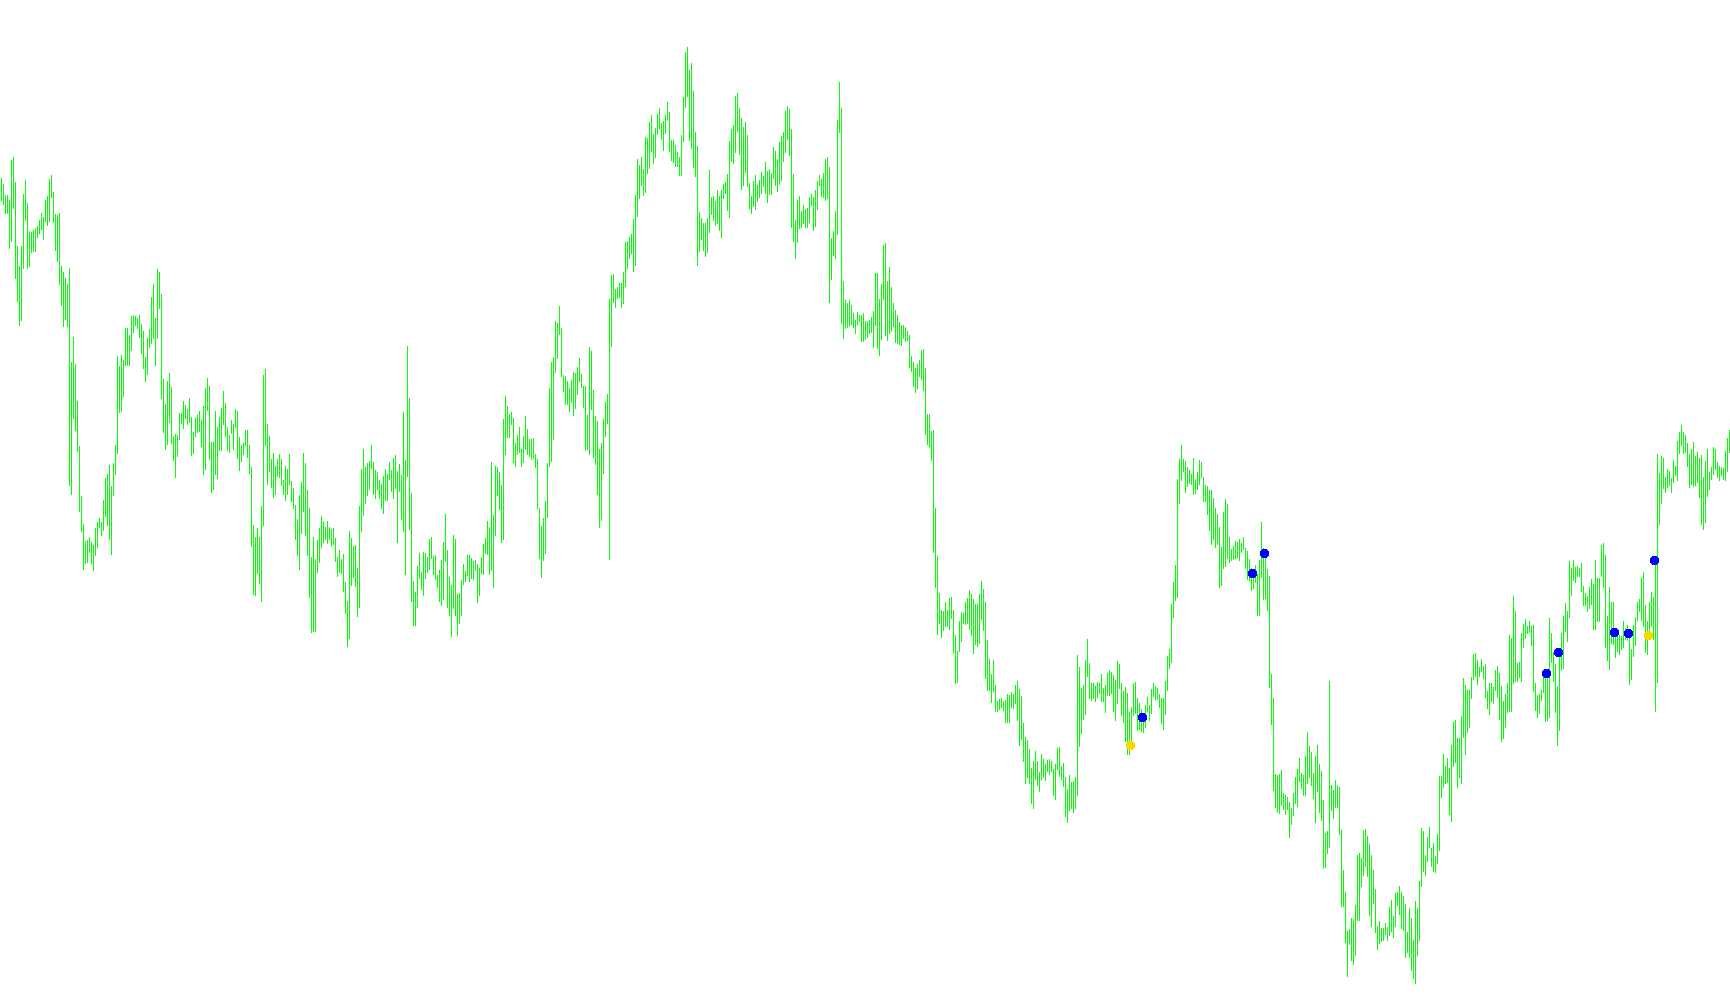
This script is a technical analysis tool designed to identify specific trend reversal points or momentum shifts on a trading chart. It functions by monitoring three distinct types of market data and looking for "confluence"—a situation where multiple different indicators agree on the same signal at the same time.
Here is a breakdown of how the logic works:
Data Collection
The tool looks at three primary components to make its decisions:
- CCI (Commodity Channel Index): This measures the current price relative to its average range. It helps the script determine if an asset is "overbought," "oversold," or moving into a new momentum phase.
- EWO (Elliot Wave Component): The script calculates the difference between two different Moving Averages (a fast 5-period average and a slower 35-period average). When these two averages move apart in a specific direction, it indicates the strength of the current trend.
- Pivot Points: The script identifies a "Pivot" price by calculating the average of the previous day's high, low, and closing prices. It then plots this as a visual reference line on your chart to help you see the "center" of the recent price action.
Signal Logic
The script generates visual signals (arrows) and alerts based on two specific conditions:
- Upward Signals: An arrow appears below the candle when the CCI moves from a negative to a positive value while the trend momentum (EWO) is also positive. This suggests that both short-term price movement and long-term trend strength are turning upward simultaneously.
- Downward Signals: An arrow appears above the candle when the CCI moves from a positive to a negative value while the trend momentum (EWO) is negative. This suggests that both indicators are aligning to show downward pressure.
User Experience Features
- Visual Cues: Instead of just showing numbers, the script places arrows directly on the chart to highlight where these crosses occur. It also draws a dotted line and a label to mark the "Pivot" price.
- Automated Alerts: The script includes a notification system. When a new signal is detected on the most recent candle, it triggers an audible alert to notify the trader instantly so they don't have to watch the screen constantly.
- Smart Filtering: The logic is designed to only trigger alerts once per new candle, preventing the system from sending multiple repetitive notifications for the same price movement.
Price Data Components
Indicators Used
Miscellaneous
15
Views
0
Downloads
0
Favorites
EWOCCI_Indicator_v1
/*-----------------------------+
|			       |
| Shared by www.Aptrafx.com    |
|			       |
+------------------------------*/

//+---------------------------------------------------------+
//| T3 Trix crossing  signals.mq4
//|
//| Perky..
//+------------------------------------------------------------------+
#property  copyright "Author - Perky Aint no Porky"

#property indicator_chart_window
#property indicator_buffers 2
#property indicator_color1 LightBlue
#property indicator_width1 3
#property indicator_color2 Red
#property indicator_width2 3

//---- input parameters
extern int smoothing=13;
extern int  timeframe=0;
extern int       A_t3_period=18;
extern int       num_bars=350;

extern int CountBars=350;
extern bool UseAlert=True;
extern bool SignalCandle=1;

//---- buffers
double val1[];
double val2[];
double CCI,CCIb4;
double EWO;
 double MA5,MA35;
int Timer;
string UD="";
double PrevPrice;
double PrevHigh  ;
double PrevLow  ;
double P  ;
double Price;

//+------------------------------------------------------------------+
//| Custom indicator initialization function                         |
//+------------------------------------------------------------------+
int init()
  {
   string short_name;
//---- indicator line
   IndicatorBuffers(2);
   SetIndexStyle(0,DRAW_ARROW);
   SetIndexArrow(0,108);
   SetIndexStyle(1,DRAW_ARROW);
   SetIndexArrow(1,108);
   SetIndexBuffer(0,val1);
   SetIndexBuffer(1,val2);
//----
   return(0);
  }
//+------------------------------------------------------------------+
//| AltrTrend_Signal_v2_2                                            |
//+------------------------------------------------------------------+
int start()
  {
  // if (CountBars>=500) CountBars=500;
  // SetIndexDrawBegin(0,500-CountBars);
  // SetIndexDrawBegin(1,500-CountBars);
  int i,shift,counted_bars=IndicatorCounted();


   //---- check for possible errors
  // if(counted_bars<0) return(-1);

   //---- initial zero
  // if(counted_bars<1)
   //  {
    //  for(i=1;i<=CountBars;i++) val1[CountBars-i]=0.0;
    //  for(i=1;i<=CountBars;i++) val2[CountBars-i]=0.0;
    // }

for ( shift = CountBars; shift>=0; shift--)
{
      PrevPrice = iClose(NULL,PERIOD_D1,SignalCandle+1);
      PrevHigh  = iHigh(NULL,PERIOD_D1,SignalCandle+1);
      PrevLow   = iLow(NULL,PERIOD_D1,SignalCandle+1);
      P = (PrevHigh + PrevLow + PrevPrice)/3;
      Price = iClose(NULL,PERIOD_H1,1); //gets close of last closed candle


    CCI =iCCI(NULL,0,55,PRICE_CLOSE,SignalCandle+shift);
    CCIb4=iCCI(NULL,0,55,PRICE_CLOSE,SignalCandle+shift+1);
    //Elliot Wave
    MA5=iMA(NULL,0,5,0,MODE_SMA,PRICE_MEDIAN,SignalCandle+shift);
    MA35=iMA(NULL,0,35,0,MODE_SMA,PRICE_MEDIAN,SignalCandle+shift);
    EWO=MA5-MA35;  // yes thats it - Elliot Wave
//Comment ( "mtfstochs=",mtfstochs,"mtfstochsb4=",mtfstochsb4,"\nmtfstochs1=",mtfstochs1,"mtfstochs1b4=",mtfstochs1b4);
 	   val1[shift]=0;
		val2[shift]=0;

if(ObjectFind("P label") != 0)
      {
      ObjectCreate("P label", OBJ_TEXT, 0, Time[20], P);
      ObjectSetText("P label", "Pivot", 8, "Arial", Magenta);
      }
       if(ObjectFind("P line") != 0)
      {
      ObjectCreate("P line", OBJ_HLINE, 0, Time[40], P);
      ObjectSet("P line", OBJPROP_STYLE, STYLE_DOT);
      ObjectSet("P line", OBJPROP_COLOR, Magenta);
      }
//if ( TTb4>TT1b4 && TT<TT1 )

 if ( CCI>=0 && CCIb4<0 &&   EWO>0)

{
		val1[shift]=Low[shift]-8*Point;

	if (shift < 2 )

	{
	   UD=" UP.";
		DoAlert(UD);
	}

}
// if ( TTb4<TT1b4 && TT>TT1)
 if ( CCI<=0 && CCIb4> 0 &&  EWO<0)
{
	val2[shift]=High[shift]+8*Point;


	 if (shift < 2 )
  {
  UD=" DOWN.";
  DoAlert(UD);
  }
}


}
   //return(0);
  }

void DoAlert(string UD)
{
   if (!NewBar() || !UseAlert)
      return;
     Alert (Symbol()," ",Period(),"T3 TRIX cross ",UD);

}


  bool NewBar()
{
   static datetime dt  = 0;
   if (dt != Time[0])
   {
      dt = Time[0];
      return(true);
   }

}

//+------------------------------------------------------------------+
Comments