ExMass
Download script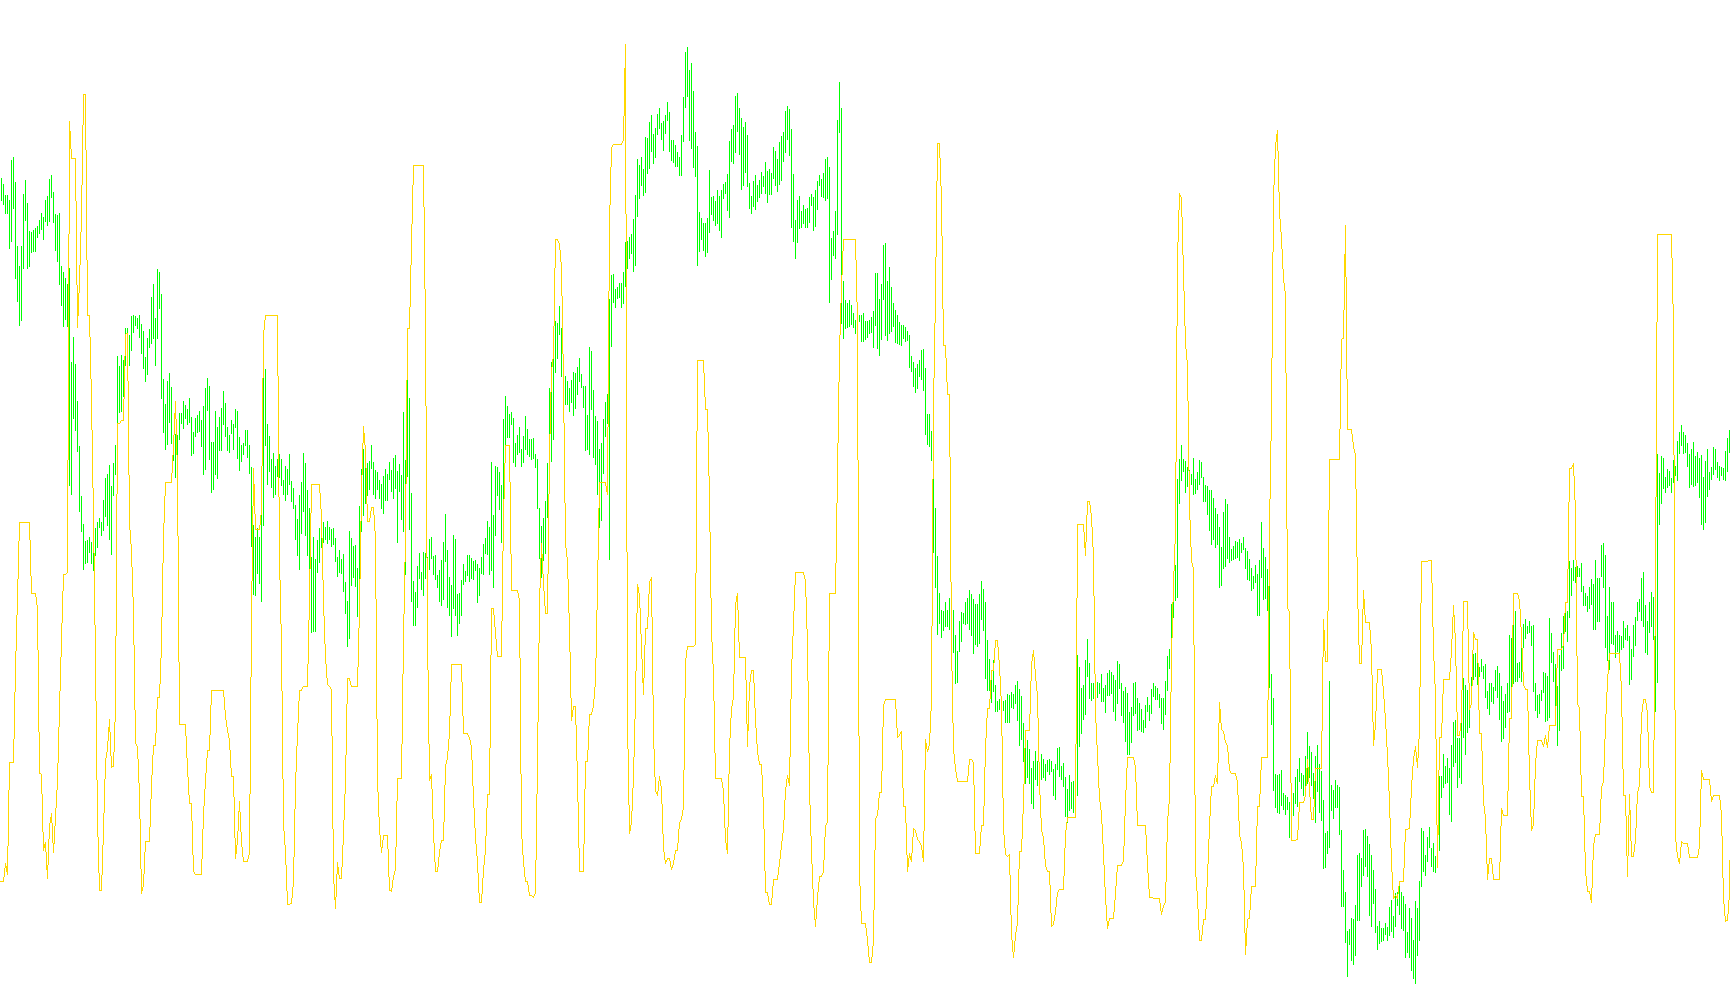
Overview of the ExMass Indicator
The ExMass indicator is a technical analysis tool designed to measure and visualize specific price movements within the trading environment. Instead of looking at individual candlesticks in isolation, this script analyzes "windows" of time to determine the relative distance between extreme price points.
Core Logic and Functionality
1. The Time Window (ExPeriod)
The indicator operates based on a user-defined timeframe, known as the ExPeriod. By default, this is set to 8 bars (candlesticks). This means that for every point plotted on your chart, the tool is looking back at the last 8 bars of data to perform its calculation.
2. Identifying Extremes For every specific period analyzed, the script performs a "scan" to find two critical values:
- The Highest High: It identifies the maximum price reached during that window.
- The Lowest Low: It identifies the minimum price reached during that same window.
By identifying these two boundaries, the indicator captures the total range of volatility—essentially measuring the "territory" covered by the market over those 8 bars.
3. The Calculation Process Once the highest and lowest points are identified, the script calculates the difference between them (the spread). It then multiplies this distance by a fixed factor (2500) to convert that raw price movement into a numerical value.
4. Visual Representation The final result is plotted as a line in a separate window below your main price chart.
- When the line moves higher, it indicates that the price range covered during that specific period was larger (greater volatility).
- When the line moves lower, it indicates that the price range was tighter (less volatility).
Summary for Traders
Think of this indicator as a "Volatility Meter." It doesn't tell you which direction the market is going; rather, it tells you how much "room" the market is moving in. It helps traders visualize whether the current market action is expanding or contracting relative to the previous period.
//+------------------------------------------------------------------+
//|                                                       ExMass.mq4 |
//|                           Copyright © 2006, Alex Sidd (Executer) |
//|                                       http://www.metaquotes.net/ |
//+------------------------------------------------------------------+
#property copyright "Copyright © 2006, Alex Sidd (Executer)"
#property link      "mailto:work_st@mail.ru"
//----
#property indicator_separate_window
#property indicator_minimum 0
#property indicator_maximum 100
#property indicator_buffers 1
#property  indicator_color1  Black
//---- input parameters
extern int ExPeriod = 8;
//---- buffers
double MassBuffer[];
//+------------------------------------------------------------------+
//| initialization function                                          |
//+------------------------------------------------------------------+
int init()
  {
   string short_name;
   IndicatorBuffers(1);
   SetIndexStyle(0, DRAW_LINE);
   SetIndexBuffer(0, MassBuffer);
   SetIndexDrawBegin(0, ExPeriod);
   short_name = "ExMass";
   IndicatorShortName(short_name);
   SetIndexLabel(0, short_name);
//----
   return(0);
  }
//+------------------------------------------------------------------+
//| Exexuter Mass Indicator                                          |
//+------------------------------------------------------------------+
int start()
  {
   int    i, counted_bars = IndicatorCounted();
   double negative,positive;
//----
   if(Bars <= ExPeriod)
       return(0);
   if(counted_bars < 1)
       for(i = 1; i <= ExPeriod; i++)
           MassBuffer[Bars-i] = 0.0;
//----
   i = Bars - ExPeriod - 1;
   if(counted_bars >= ExPeriod)
       i = Bars - counted_bars - 1;
   while(i >= 0)
     {
       negative = 1000;
       positive = 0;
       if(i < Bars - ExPeriod - 1)
         {
           int k = i + ExPeriod;
           while(k >= i)
             {
               if(High[k] > positive)
                   positive = High[k];
               if(Low[k] < negative)
                   negative = Low[k];
               k--;
             }
         }
       MassBuffer[i] = (positive - negative)*2500;
       i--;
     }
//----
   return(0);
  }
//+------------------------------------------------------------------+
Comments