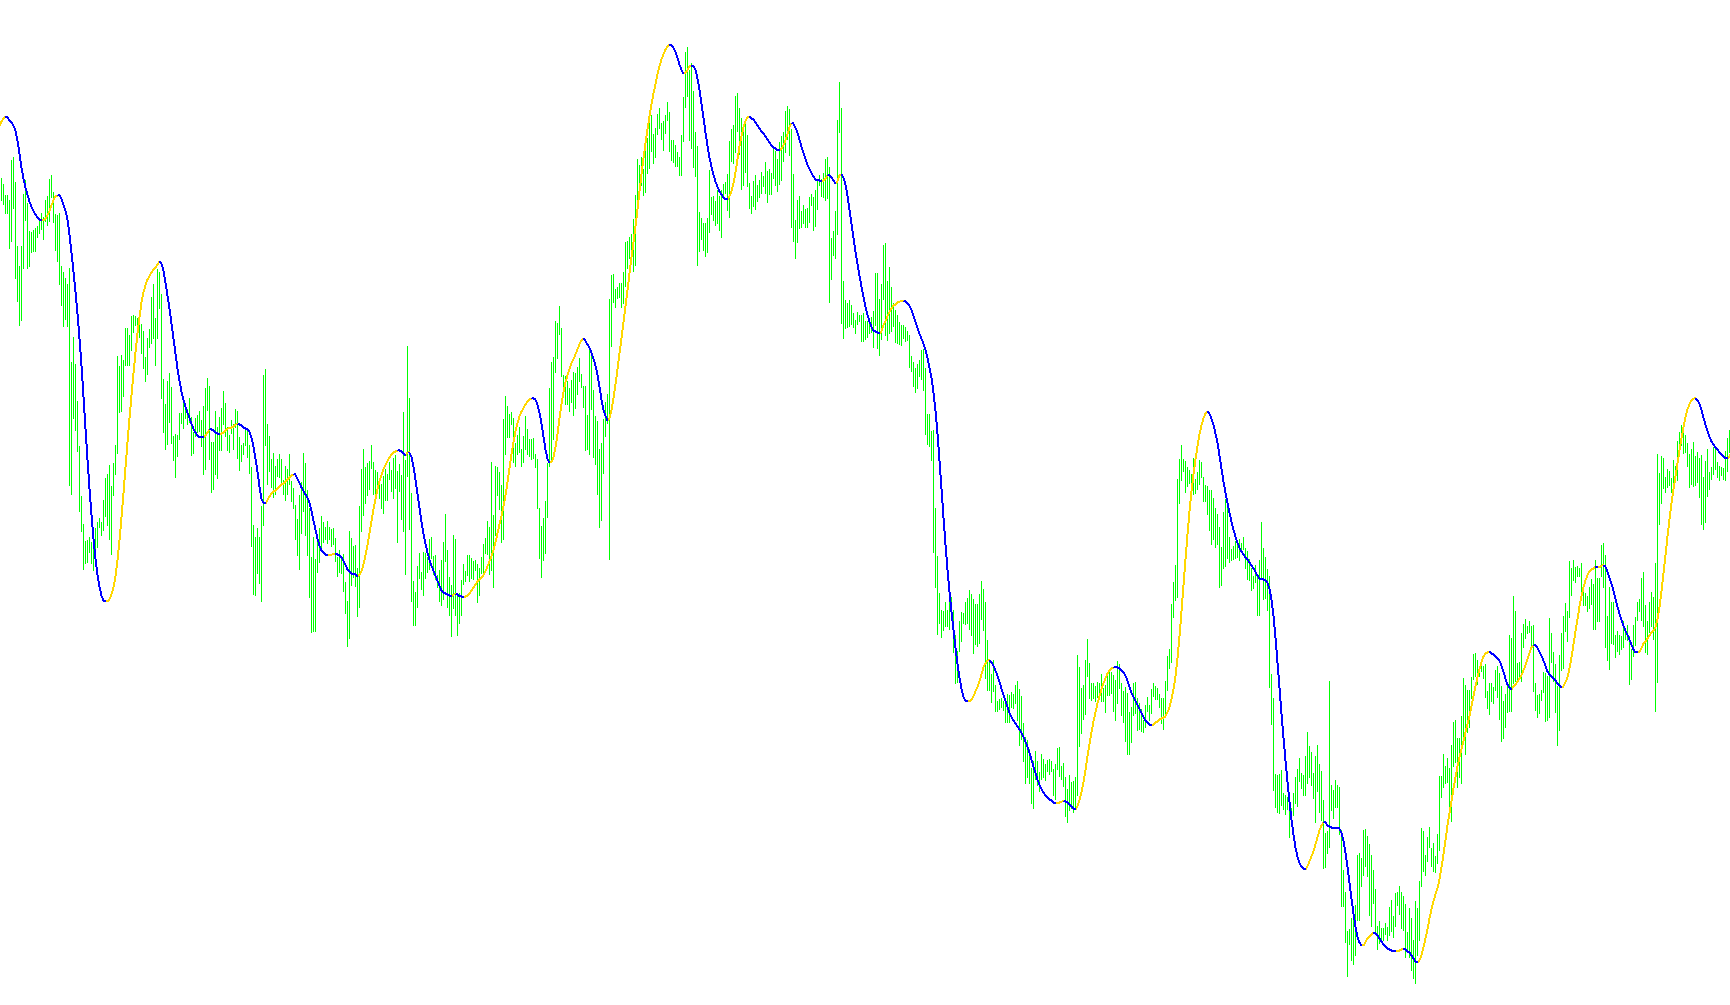
This tool is designed to analyze price movements and identify specific trends based on the relationship between different moving averages. Instead of just showing a standard average of the price, it uses a multi-step mathematical process to filter out market noise and highlight significant shifts in direction.
How the Logic Works
1. Momentum Calculation (The Vector) The script begins by calculating a "vector." It does this by taking two different weighted moving averages: one based on a standard period and another based on half of that period. By doubling the smaller period average and subtracting the larger one, the tool creates a specialized data point that emphasizes the current momentum of the market.
2. Smoothing the Data To ensure the signals are not reacting to every minor price flicker, the script takes that "vector" data and applies a second smoothing pass. This creates a more stable line, making it easier to see the underlying trend rather than just temporary volatility.
3. Trend Identification The tool then monitors this smoothed line to determine the current market direction:
- Upward Movement: If the smoothed value is higher than it was in the previous step, the script identifies an upward trend.
- Downward Movement: If the smoothed value is lower than it was in the previous step, it identifies a downward trend.
Visual Representation on Your Chart
The indicator displays these findings using two distinct lines in a separate window below your main price chart:
- Blue Line (Uptrend): This line appears when the logic confirms a positive momentum shift. It highlights where the market is showing strength.
- Red Line (Downtrend): This line appears when the logic confirms a negative momentum shift, highlighting where the market is showing weakness.
When the trend changes, the script "switches" between these two lines, allowing you to visually distinguish between periods of growth and periods of decline based on the calculated momentum.
#property indicator_separate_window
#property indicator_buffers 2
#property indicator_color1 Blue
#property indicator_color2 Red
//---- input parameters
extern int       period=40;
int       method=3;                         // MODE_SMA
int       price=0;                          // PRICE_CLOSE
//---- buffers
double Uptrend[];
double Dntrend[];
double ExtMapBuffer[];


//+------------------------------------------------------------------+
//| Custom indicator initialization function                         |
//+------------------------------------------------------------------+
int init()
{
    IndicatorBuffers(3);
    SetIndexBuffer(0, Uptrend);
    //ArraySetAsSeries(Uptrend, true);
    SetIndexBuffer(1, Dntrend);
    //ArraySetAsSeries(Dntrend, true);
    SetIndexBuffer(2, ExtMapBuffer);
    ArraySetAsSeries(ExtMapBuffer, true);

    SetIndexStyle(0,DRAW_LINE,STYLE_SOLID,2);
    SetIndexStyle(1,DRAW_LINE,STYLE_SOLID,2);

    IndicatorShortName("Execute Line("+period+")");
    return(0);
}

//+------------------------------------------------------------------+
//| Custor indicator deinitialization function                       |
//+------------------------------------------------------------------+
int deinit()
{
    // ???? ????? ?????? ??????
    return(0);
}

//+------------------------------------------------------------------+
//| ?????????? ???????                                               |
//+------------------------------------------------------------------+
double WMA(int x, int p)
{
    return(iMA(NULL, 0, p, 0, method, price, x));
}

//+------------------------------------------------------------------+
//| Custom indicator iteration function                              |
//+------------------------------------------------------------------+
int start()
{
    int counted_bars = IndicatorCounted();

    if(counted_bars < 0)
        return(-1);

    int x = 0;
    int p = MathSqrt(period);
    int e = Bars - counted_bars + period + 1;

    double vect[], trend[];

    if(e > Bars)
        e = Bars;

    ArrayResize(vect, e);
    ArraySetAsSeries(vect, true);
    ArrayResize(trend, e);
    ArraySetAsSeries(trend, true);

    for(x = 0; x < e; x++)
    {
        vect[x] = 2*WMA(x, period/2) - WMA(x, period);
 //       Print("Bar date/time: ", TimeToStr(Time[x]), " close: ", Close[x], " vect[", x, "] = ", vect[x], " 2*WMA(p/2) = ", 2*WMA(x, period/2), " WMA(p) = ",  WMA(x, period));
    }

    for(x = 0; x < e-period; x++)

        ExtMapBuffer[x] = iMAOnArray(vect, 0, p, 0, method, x);

    for(x = e-period; x >= 0; x--)
    {
        trend[x] = trend[x+1];
        if (ExtMapBuffer[x]> ExtMapBuffer[x+1]) trend[x] =1;
        if (ExtMapBuffer[x]< ExtMapBuffer[x+1]) trend[x] =-1;

    if (trend[x]>0)
    { Uptrend[x] = ExtMapBuffer[x];
      if (trend[x+1]<0) Uptrend[x+1]=ExtMapBuffer[x+1];
      Dntrend[x] = EMPTY_VALUE;
    }
    else
    if (trend[x]<0)
    {
      Dntrend[x] = ExtMapBuffer[x];
      if (trend[x+1]>0) Dntrend[x+1]=ExtMapBuffer[x+1];
      Uptrend[x] = EMPTY_VALUE;
    }

    //Print( " trend=",trend[x]);
    }

    return(0);
}
//+------------------------------------------------------------------+
Comments