ew1_v1
Download script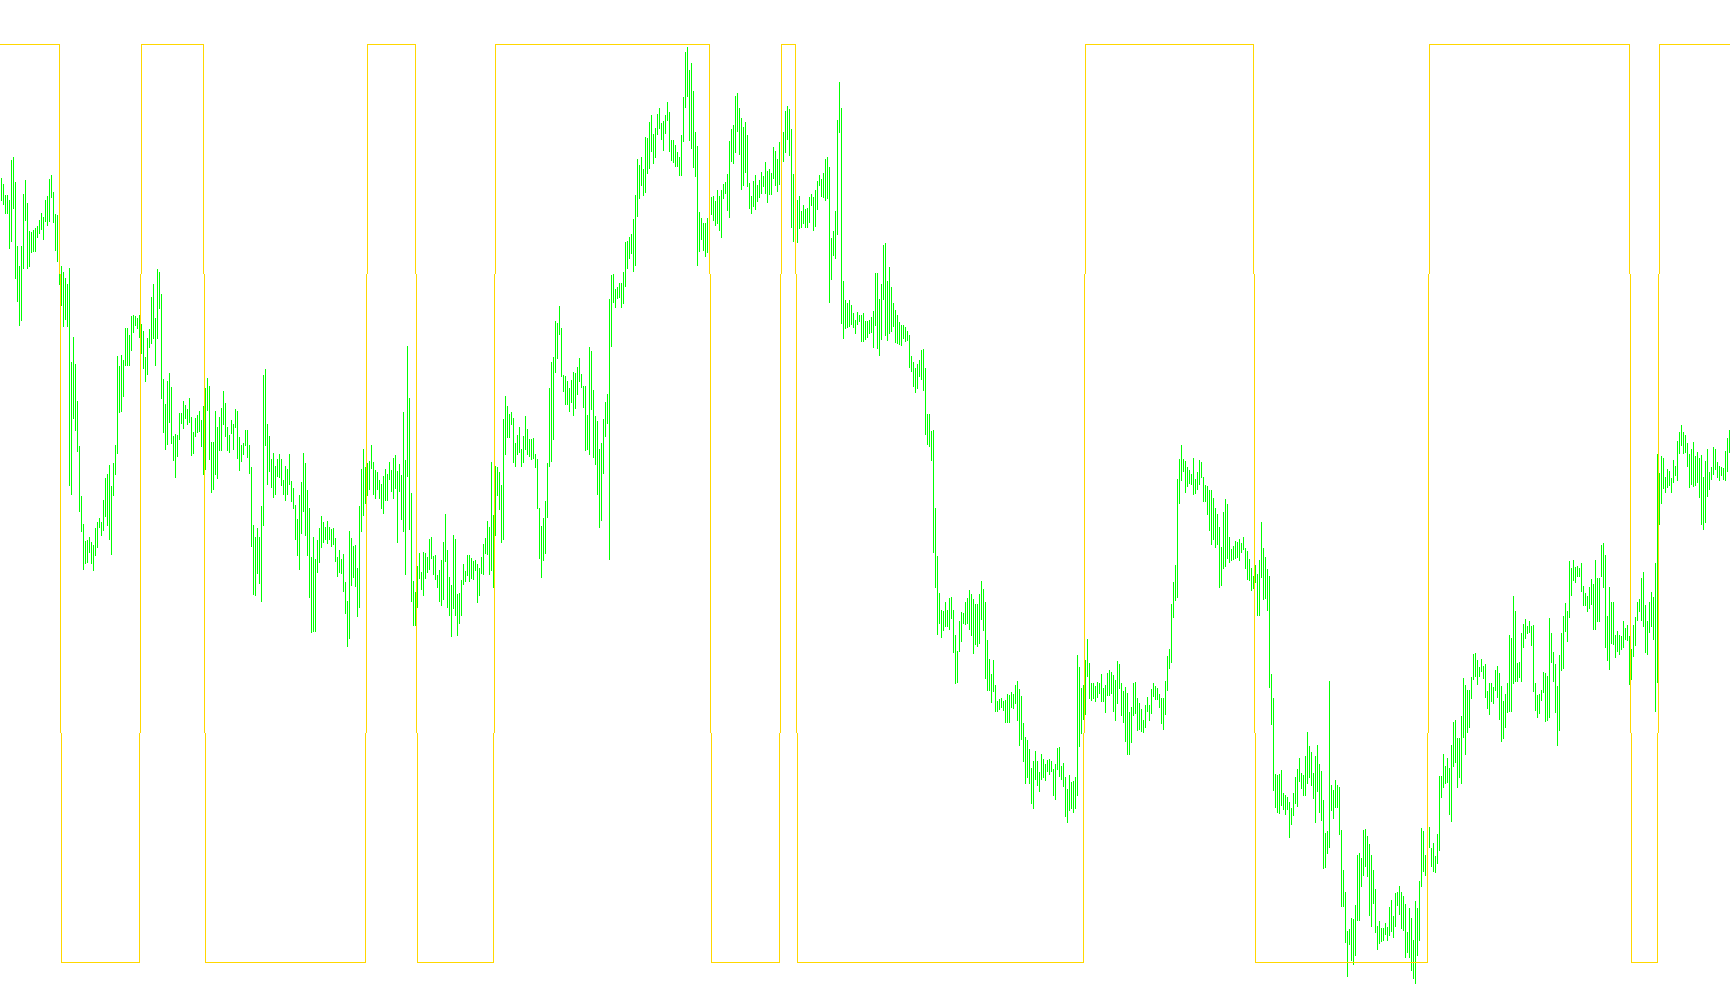
This technical indicator is designed to provide traders with a visual representation of market momentum and trend direction by analyzing the relationship between two different moving averages. It operates on a separate window, allowing you to see the overall "flow" of the market independently of the price action.
Core Mechanics and Logic
The script functions by calculating the distance (or spread) between a fast-moving average and a slow-moving average based on median prices. Here is how the logic unfolds:
1. The Foundation: Momentum Measurement The tool constantly looks at the difference between a short-term average (5 periods) and a long-term average (35 periods). When these two averages are far apart, it indicates strong momentum; when they are close together, the market is consolidating.
2. Historical Contextualization Rather than just looking at the current moment, the script performs a "look-back" analysis over a specific period (defined by the backtest variable). It identifies the highest and lowest momentum values reached during this recent window. This allows the tool to understand where the market currently stands in relation to its recent highs and lows.
3. Trend Identification The indicator uses these high and low points to determine the current "trend" state:
- Breakout Logic: If the current momentum reaches a new historical high (within that look-back period), it signals a potential upward shift.
- Breakdown Logic: If the current momentum reaches a new historical low, it signals a potential downward shift.
4. Dynamic Reversal Signals The script includes a sophisticated "trigger" mechanism to handle trend reversals. Instead of simply switching directions whenever the averages cross, it monitors how far the momentum has pulled away from the zero line:
- If the trend is currently bearish (negative) but the momentum begins to move back toward the center with enough strength (calculated against your specific trigger percentage), the tool can switch the trend status to bullish.
- Conversely, if the trend is bullish (positive) but starts to drop significantly back toward the center, it signals a shift back to bearish.
Summary for the User
In plain terms, this script acts as a momentum filter. It ignores minor "noise" by looking at the historical highs and lows of the price average. It identifies when the market is pushing toward new extremes and provides a visual cue (a line in the indicator window) that tells you whether the current strength is leaning bullish or bearish based on these mathematical boundaries.
/*-----------------------------+
|			       |
| Shared by www.Aptrafx.com    |
|			       |
+------------------------------*/

#include <stdlib.mqh>
//+------------------------------------------------------------------+
//|                                                             .mq4 |
//|                                                                  |
//|                                                                  |
//|                                        Converted by Mql2Mq4 v0.7 |
//|                                            http://yousky.free.fr |
//|                                    Copyright © 2006, Yousky Soft |
//+------------------------------------------------------------------+

//#property copyright " CONVERT BY "ENG.AED AL NAIRAB" ."
#property link      " http://www.nairab.com/"

#property indicator_separate_window
#property indicator_color1 Blue
#property indicator_buffers 1

//+------------------------------------------------------------------+
//| Common External variables                                        |
//+------------------------------------------------------------------+

//+------------------------------------------------------------------+
//| External variables                                               |
//+------------------------------------------------------------------+
extern double triger = 0.70;
extern double back_test = 20;

//+------------------------------------------------------------------+
//| Special Convertion Functions                                     |
//+------------------------------------------------------------------+

int LastTradeTime;
double ExtHistoBuffer[];

void SetLoopCount(int loops)
{
}

void SetIndexValue(int shift, double value)
{
  ExtHistoBuffer[shift] = value;
}

//+------------------------------------------------------------------+
//| End                                                              |
//+------------------------------------------------------------------+

//+------------------------------------------------------------------+
//| Initialization                                                   |
//+------------------------------------------------------------------+

int init()
{
   SetIndexStyle(0, DRAW_LINE, STYLE_SOLID);
   SetIndexBuffer(0, ExtHistoBuffer);
   SetIndexStyle(1, DRAW_LINE, STYLE_SOLID);
   return(0);
}
int start()
{
//+------------------------------------------------------------------+
//| Local variables                                                  |
//+------------------------------------------------------------------+
int shift = 0;
int i = 0;
double llv = 0;
double hhv = 0;
double taiv = 0;
double trend = 0;

/*[[
	Name := ew1
	Author := CONVERT BY "ENG.AED AL NAIRAB" .
	Link := http://www.nairab.com/
	Separate Window := yes
	First Color := Blue
	First Draw Type := Line
	First Symbol := 217
	Use Second Data := no
	Second Color := Red
	Second Draw Type := Line
	Second Symbol := 218
]]*/


SetLoopCount(0);
// loop from first bar to current bar (with shift=0)
for(shift=900;shift>=0 ;shift--){
llv=iMA(NULL, 0, 5, 0, MODE_SMA, PRICE_MEDIAN, shift)-iMA(NULL, 0, 35, 0, MODE_SMA, PRICE_MEDIAN, shift);
hhv=iMA(NULL, 0, 5, 0, MODE_SMA, PRICE_MEDIAN, shift)-iMA(NULL, 0, 35, 0, MODE_SMA, PRICE_MEDIAN, shift);
for(i=shift;i<=shift+back_test ;i++){
llv=MathMin(iMA(NULL, 0, 5, 0, MODE_SMA, PRICE_MEDIAN, i)-iMA(NULL, 0, 35, 0, MODE_SMA, PRICE_MEDIAN, i),llv);
hhv=MathMax(iMA(NULL, 0, 5, 0, MODE_SMA, PRICE_MEDIAN, i)-iMA(NULL, 0, 35, 0, MODE_SMA, PRICE_MEDIAN, i),hhv);
}
if( ( hhv == (iMA(NULL, 0, 5, 0, MODE_SMA, PRICE_MEDIAN, shift)-iMA(NULL, 0, 35, 0, MODE_SMA, PRICE_MEDIAN, shift))&& trend == 0)) trend=1;
if( ( llv == (iMA(NULL, 0, 5, 0, MODE_SMA, PRICE_MEDIAN, shift)-iMA(NULL, 0, 35, 0, MODE_SMA, PRICE_MEDIAN, shift))&& trend == 0)) trend=-1;
if( ( llv<0 && trend == -1 && (iMA(NULL, 0, 5, 0, MODE_SMA, PRICE_MEDIAN, shift)-iMA(NULL, 0, 35, 0, MODE_SMA, PRICE_MEDIAN, shift))>-1*triger*llv)) trend=1;
if( ( hhv>0 && trend == 1 && (iMA(NULL, 0, 5, 0, MODE_SMA, PRICE_MEDIAN, shift)-iMA(NULL, 0, 35, 0, MODE_SMA, PRICE_MEDIAN, shift))<-1*triger*hhv)) trend=-1;
	SetIndexValue(shift, trend);

}

  return(0);
}
Comments