Adaptive RSI
Download script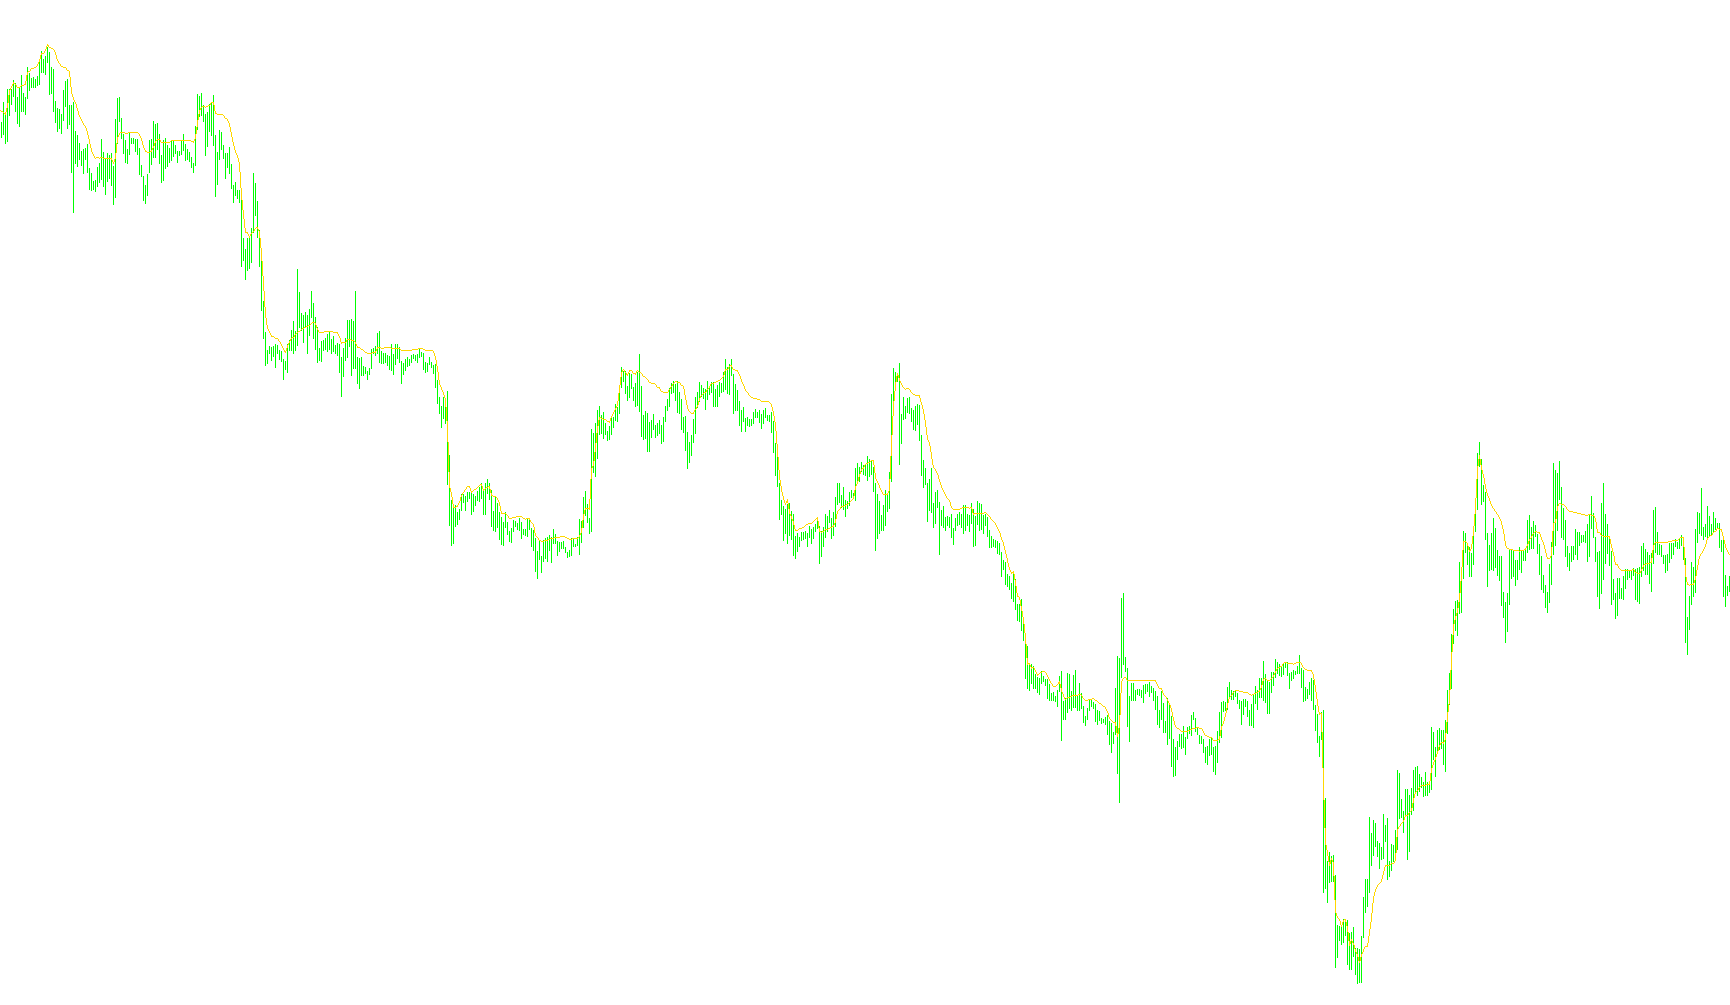
This tool is designed to provide traders with a unique visual representation of market momentum by blending traditional price action with the Relative Strength Index (RSI) logic. Instead of simply showing you a standard oscillator, it creates a dynamic "smoothed" price line that adapts its behavior based on how strongly the market is moving.
How the Logic Works
The script operates by analyzing two primary factors: the current closing price of an asset and the intensity of its recent momentum (measured via the RSI). Here is the step-by-step breakdown of how it processes data:
- Momentum Sensitivity: The tool calculates a "sensitivity score" based on the RSI. This score determines how much weight to give to new price changes versus historical data.
- Dynamic Smoothing: Unlike a standard moving average, which treats every price point with equal importance, this script adjusts itself. If the market is showing significant momentum, the indicator reacts more quickly to new price movements. When the market is less volatile or trending steadily, it smooths out the noise to provide a clearer picture of the underlying trend.
- Recursive Calculation: The tool builds its current value by taking the previous value and adding a portion of the difference between the current price and that previous value. This "portion" is determined by the momentum score mentioned above.
- Initial Calibration: To ensure accuracy, the script requires a minimum amount of historical data (defined by your chosen period) before it begins generating its primary line. Once initialized, it creates a continuous flow that helps traders see the "velocity" of the price.
Key Takeaways for Traders
By using this logic, you are essentially viewing a version of the price chart that has been "filtered" through a momentum lens. It aims to bridge the gap between raw price action and technical oscillators, providing a smoother curve that highlights significant trends while reducing the "jitter" often found in standard charts. This makes it easier to identify whether a current price move has actual strength behind it or is merely minor fluctuation.
//+------------------------------------------------------------------+
//| ARSI.mq4
//+------------------------------------------------------------------+
#property copyright "Alexander Kirilyuk M."
#property link ""

#property indicator_separate_window
//#property indicator_chart_window
#property indicator_buffers 3
#property indicator_color1 DodgerBlue
#property indicator_color2 LimeGreen
#property indicator_color3 Red

extern int ARSIPeriod = 14;

//---- buffers
double ARSI[];
double adrsiup[];
double adrsidn[];
int init()
{
	string short_name = "ARSI (" + ARSIPeriod + ")";

	SetIndexStyle(0,DRAW_LINE);
	SetIndexBuffer(0,ARSI);
	//SetIndexDrawBegin(0,ARSIPeriod);

	return(0);
}

int start()
{
	int i, counted_bars = IndicatorCounted();
	int limit;

	if(Bars <= ARSIPeriod)
		return(0);

	if(counted_bars < 0)
	{
		return;
	}

	if(counted_bars == 0)
	{
		limit = Bars;
	}
	if(counted_bars > 0)
	{
		limit = Bars - counted_bars;
	}

	double sc;
	for(i = limit; i >= 0; i--)
	{
		sc = MathAbs(iRSI(NULL, 0, ARSIPeriod, PRICE_CLOSE, i)/100.0 - 0.5) * 2.0;

		if( Bars - i <= ARSIPeriod)
			ARSI[i] = Close[i];
		else
			ARSI[i] = ARSI[i+1] + sc * (Close[i] - ARSI[i+1]);
	}

	return(0);
}
Comments