Sem SAR+ADX+StDev
Download script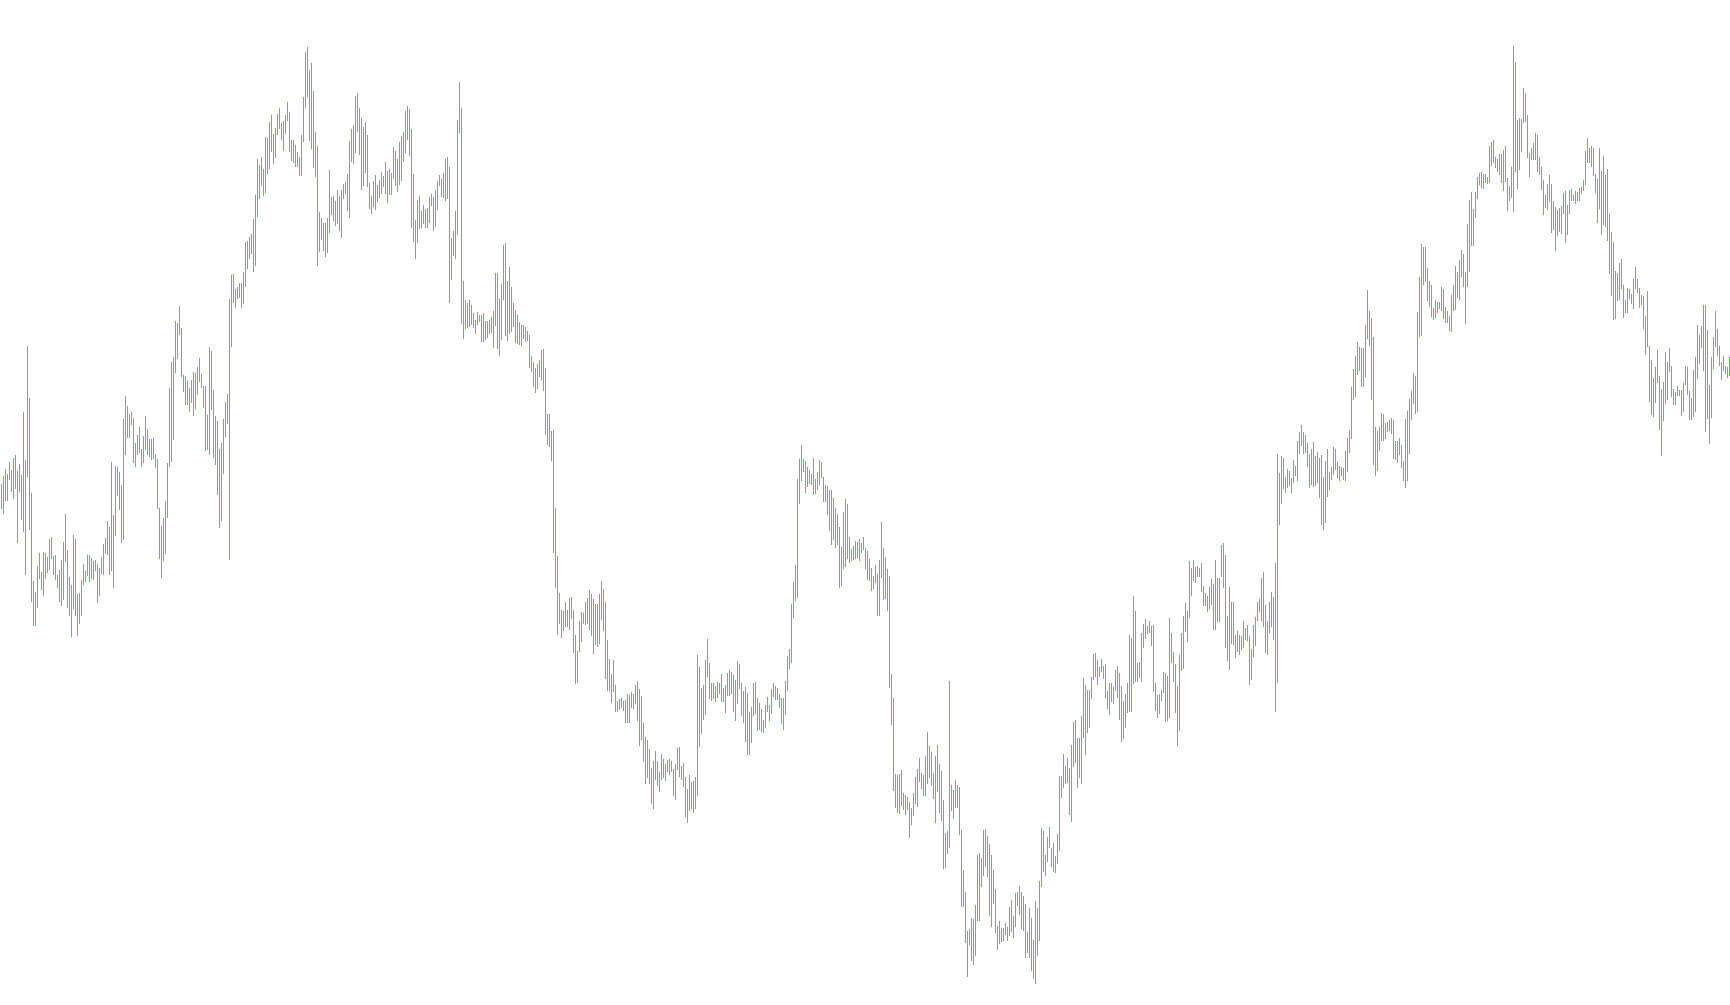
This tool is designed as a visual market analysis indicator that combines three distinct mathematical models to identify trends and potential entry points. Instead of looking at just one price movement, it evaluates the relationship between momentum, volatility, and trend direction to provide a clearer picture of market behavior.
Core Components
The logic operates by simultaneously analyzing three key technical metrics:
- Parabolic SAR: This tracks the "trajectory" of the price. It helps determine if the market is currently in an uptrend or a downtrend by identifying the points where price direction shifts.
- ADX (Average Directional Index): This measures the strength of a trend. It distinguishes between the upward pressure (positive movement) and downward pressure (negative movement) to see which side has the upper hand.
- Standard Deviation: This measures market volatility. It tells the tool how much the price is "stretching" or swinging away from its average, providing a sense of how aggressive the current moves are.
How the Logic Works
The script processes historical data to generate four distinct visual signals (represented as histograms). It makes decisions based on specific "scenarios" where these three metrics overlap:
- Strong Sell Signals: When the Parabolic SAR suggests a downward trend and the momentum indicators show that downward pressure is overpowering upward pressure, the tool highlights the current volatility.
- Strong Buy Signals: Conversely, when the Parabolic SAR suggests an upward trend and the momentum shows upward pressure dominating, it captures the volatility of that move.
- Weak Sell/Buy Scenarios: The script also identifies "weak" signals. These occur when the price direction (Parabolic SAR) and the momentum (ADX) are in conflict—for example, if the price is trying to move up, but the momentum is still pushing down.
Summary for the User
Essentially, this tool filters out "noise" by requiring multiple conditions to be met before it plots a value on your chart. It doesn't just tell you what the price is doing; it tells you how strongly the market is moving in a specific direction by checking if the momentum, the trend trajectory, and the price volatility are all telling the same story.
//+------------------------------------------------------------------+
//|                                  Áîëüøàÿ Êîëëåêöèÿ Ñåìàôîðîâ.mq4 |
//+------------------------------------------------------------------+
#property copyright "Ñåðãååâ Àëåêñåé (ñ) 2007"

#property indicator_separate_window
#property indicator_minimum 0

#property indicator_buffers 4
#property indicator_width1 2
#property indicator_width2 2
#property indicator_width3 1
#property indicator_width4 1
#property indicator_color1 Crimson
#property indicator_color2 LimeGreen
#property indicator_color3 Crimson
#property indicator_color4 LimeGreen
#property indicator_style1 STYLE_SOLID
#property indicator_style2 STYLE_SOLID
#property indicator_style3 STYLE_SOLID
#property indicator_style4 STYLE_SOLID

//---- buffers
double ExtMapBuffer1[];
double ExtMapBuffer2[];
double ExtMapBuffer3[];
double ExtMapBuffer4[];
double ExtMapBuffer5[];

int init()
{
  SetIndexStyle(0,DRAW_HISTOGRAM); SetIndexBuffer(0,ExtMapBuffer1);
  SetIndexStyle(1,DRAW_HISTOGRAM); SetIndexBuffer(1,ExtMapBuffer2);
  SetIndexStyle(2,DRAW_HISTOGRAM); SetIndexBuffer(2,ExtMapBuffer3);
  SetIndexStyle(3,DRAW_HISTOGRAM); SetIndexBuffer(3,ExtMapBuffer4);
	IndicatorShortName("SAR+ADX+StdDiv");
	return(0);
}

int deinit() { return(0); }

int start()
{
	double sar, std, adxP,adxN;
	int Mode=MODE_EMA;//0-sma, 1-ema, 2-smma, 3-lwma
	int Price=PRICE_CLOSE;//0-close, 1-open, 2-high, 3-low, 4-median, 5-typic, 6-wieight

	for (int i = 0; i < 5000; i++)
	{
		ExtMapBuffer1[i]=0; ExtMapBuffer2[i]=0; ExtMapBuffer3[i]=0; ExtMapBuffer4[i]=0;

		adxP=iADX(NULL,0,14 ,PRICE_CLOSE,1,i);//+DI
		adxN=iADX(NULL,0,14 ,PRICE_CLOSE,2,i);//-DI
		std =iStdDev(NULL,0,10,0,Mode,Price,i) ;
		sar =iSAR(NULL,0,0.02,0.2,i) ;

		if (sar > Close[i] && adxN > adxP){ ExtMapBuffer1[i] = std; }//ïðîäàåì ñèëüíî
		if (sar < Close[i] && adxP > adxN){ ExtMapBuffer2[i] = std; }//ïîêóïàåì ñèëüíî
		if (sar > Close[i] && adxP > adxN){ ExtMapBuffer3[i] = std; }//ïðîäàåì ñëàáî
		if (sar < Close[i] && adxN > adxP){ ExtMapBuffer4[i] = std; }//ïîêóïàåì ñëàáî
	}
	return(0);
}
//+------------------------------------------------------------------+
Comments