CCI_Woodies_Lnx_v3_1_v2
Indicator

CCI_Woodies_Lnx_v3_1_v2

iCCIiMA

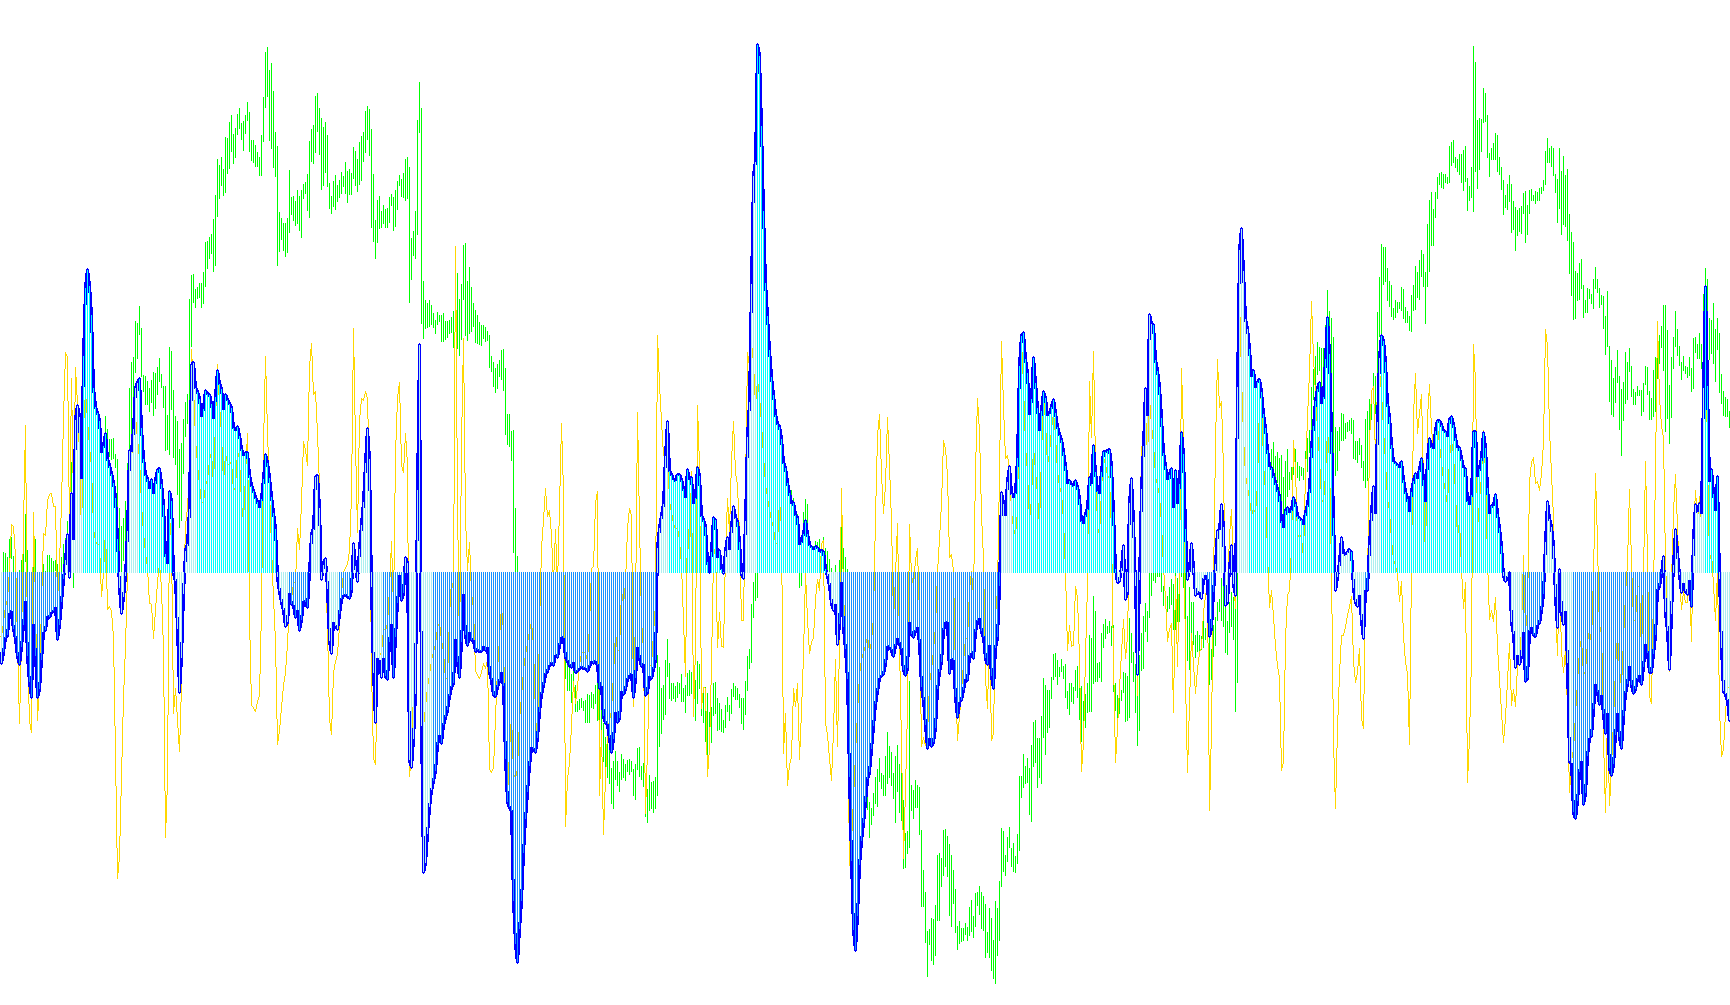
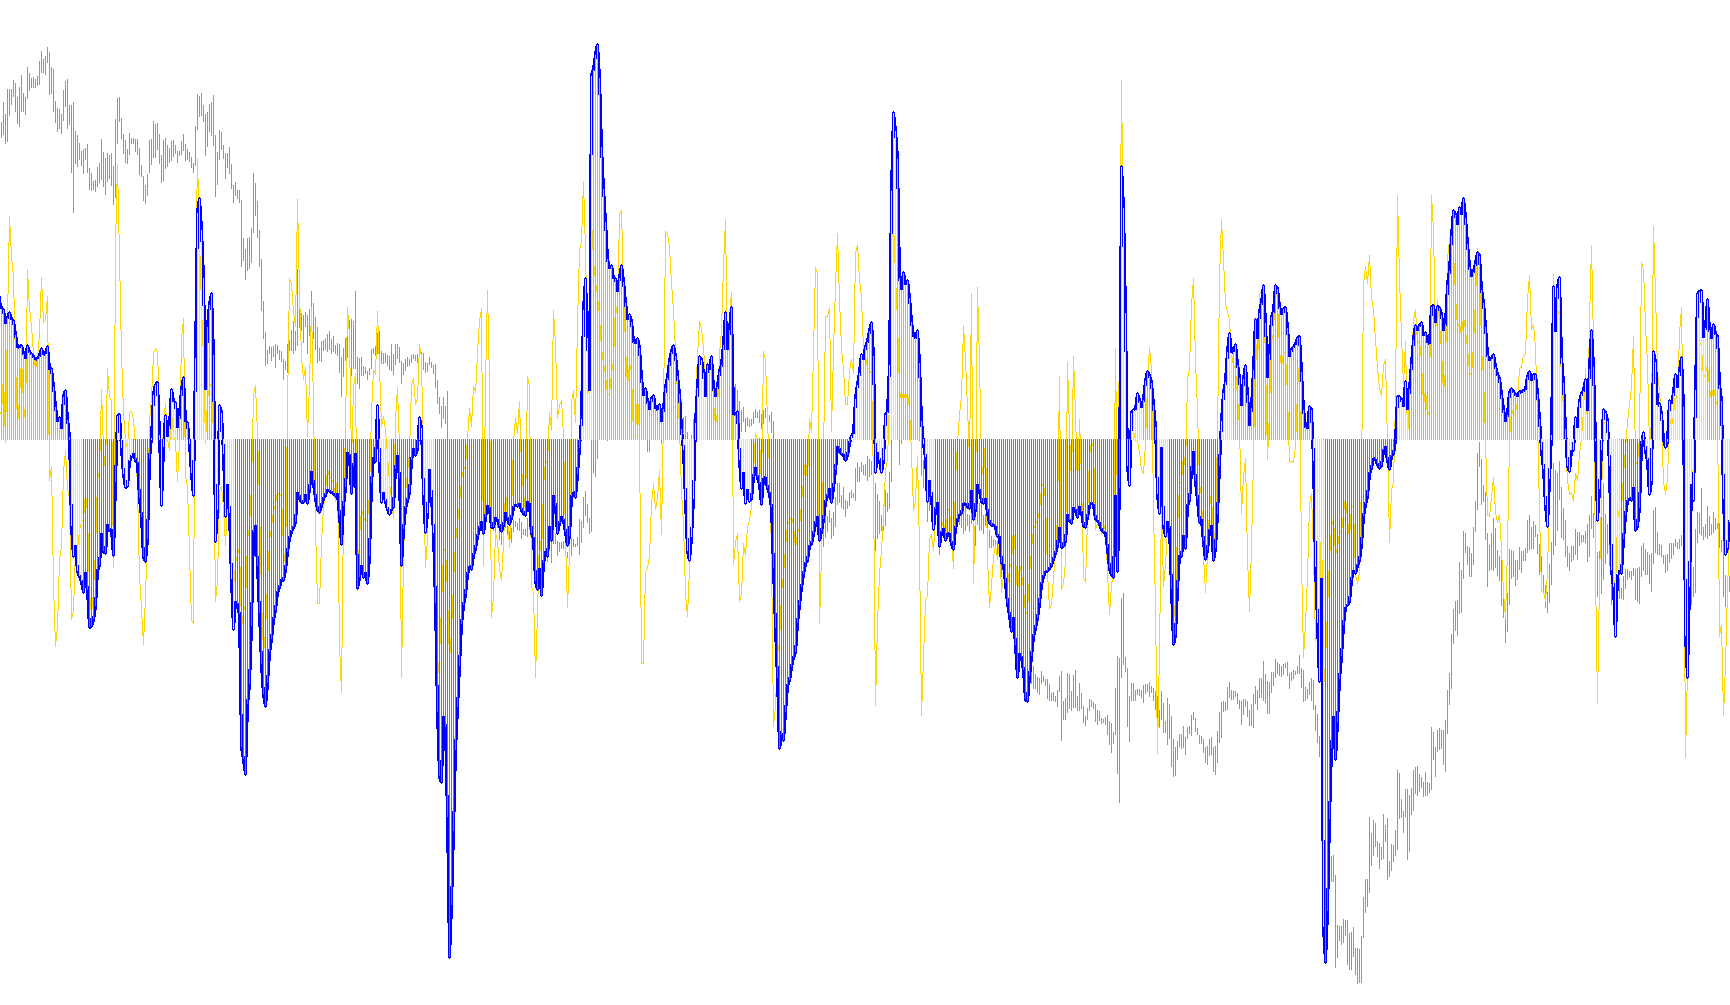
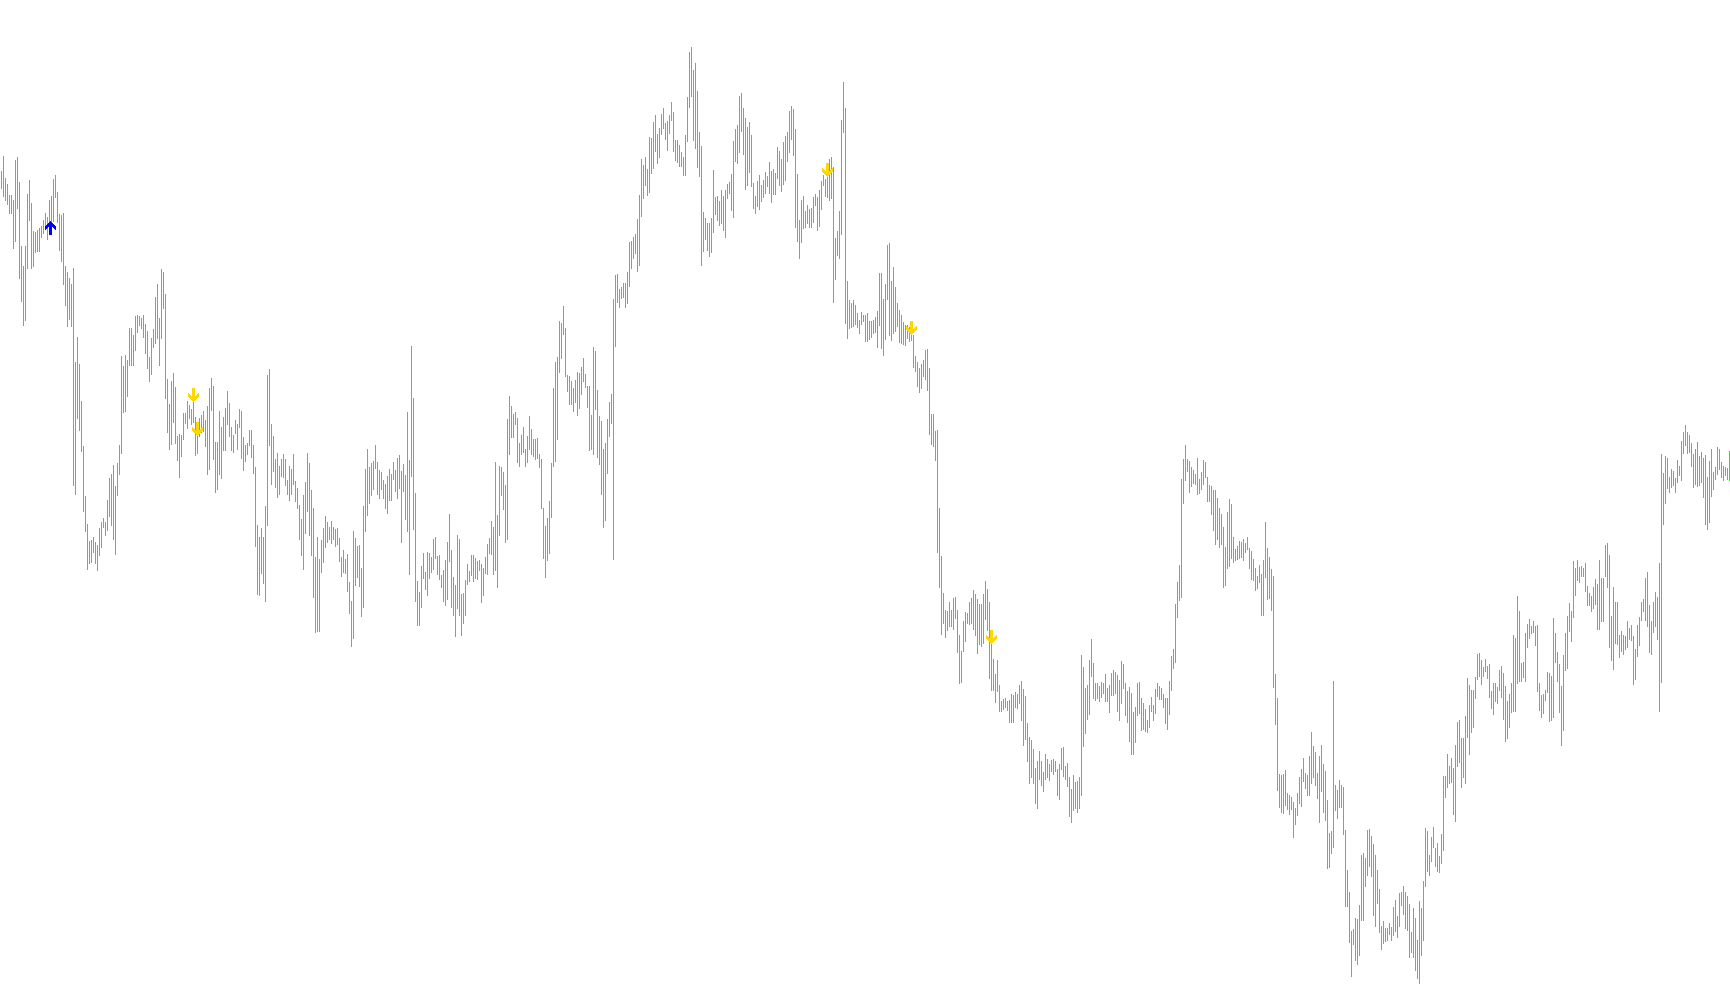
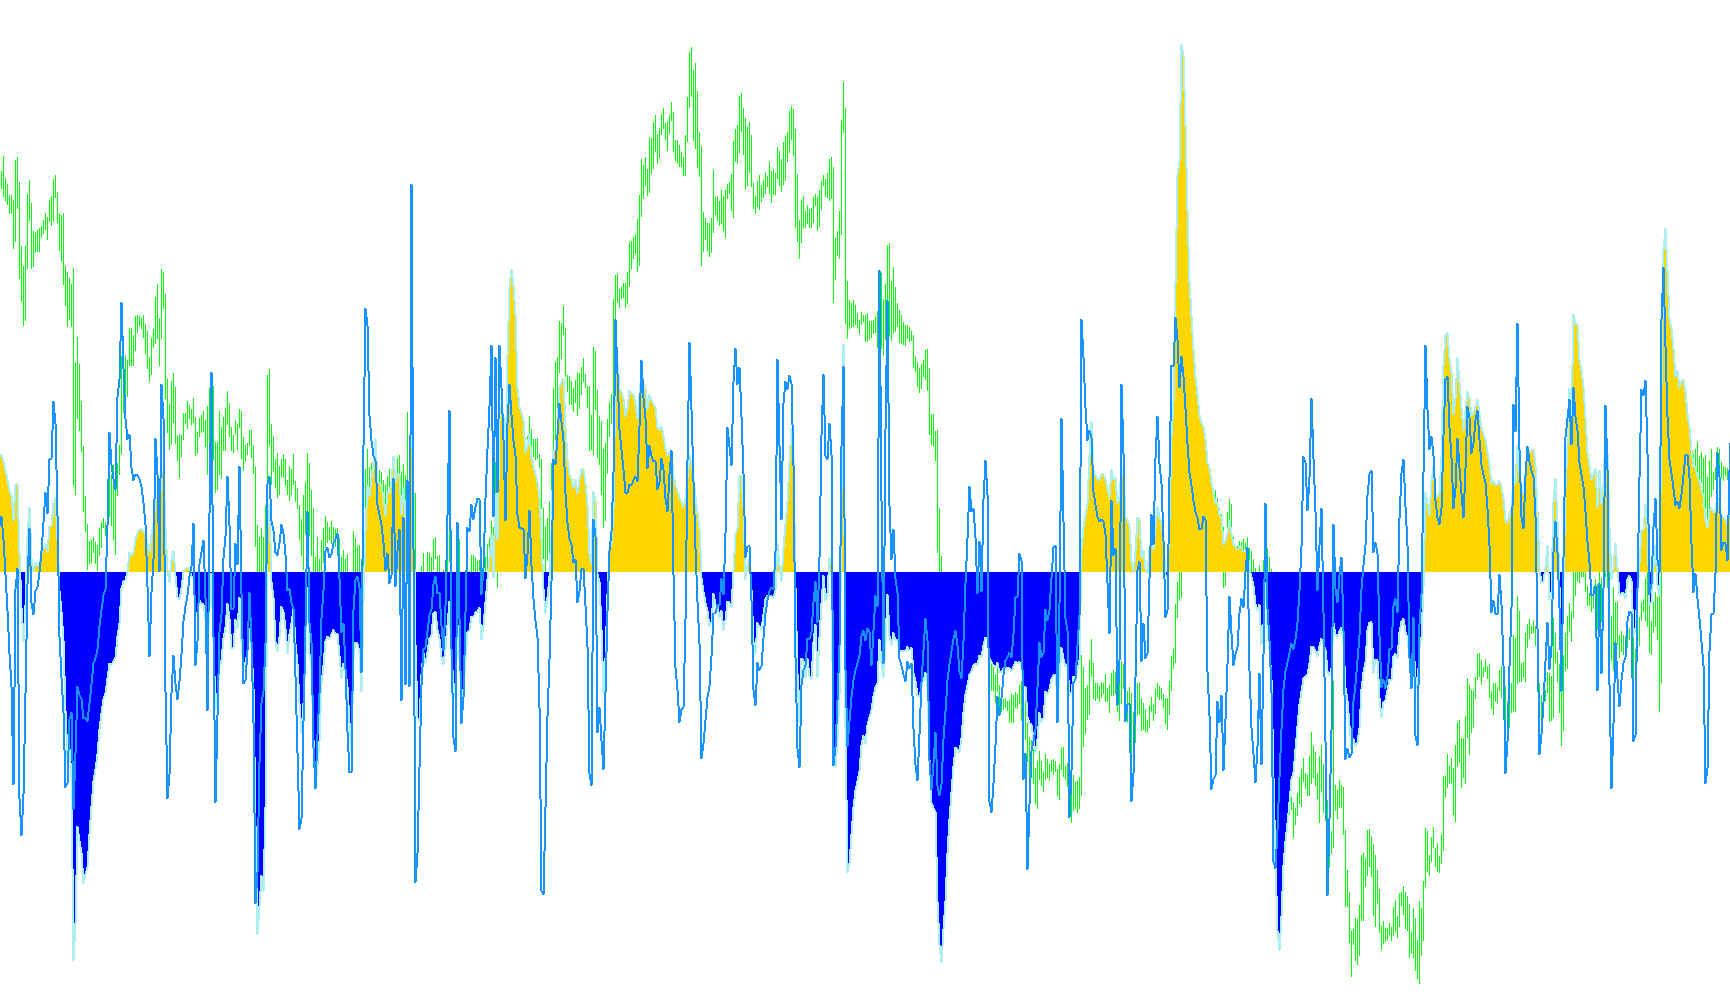
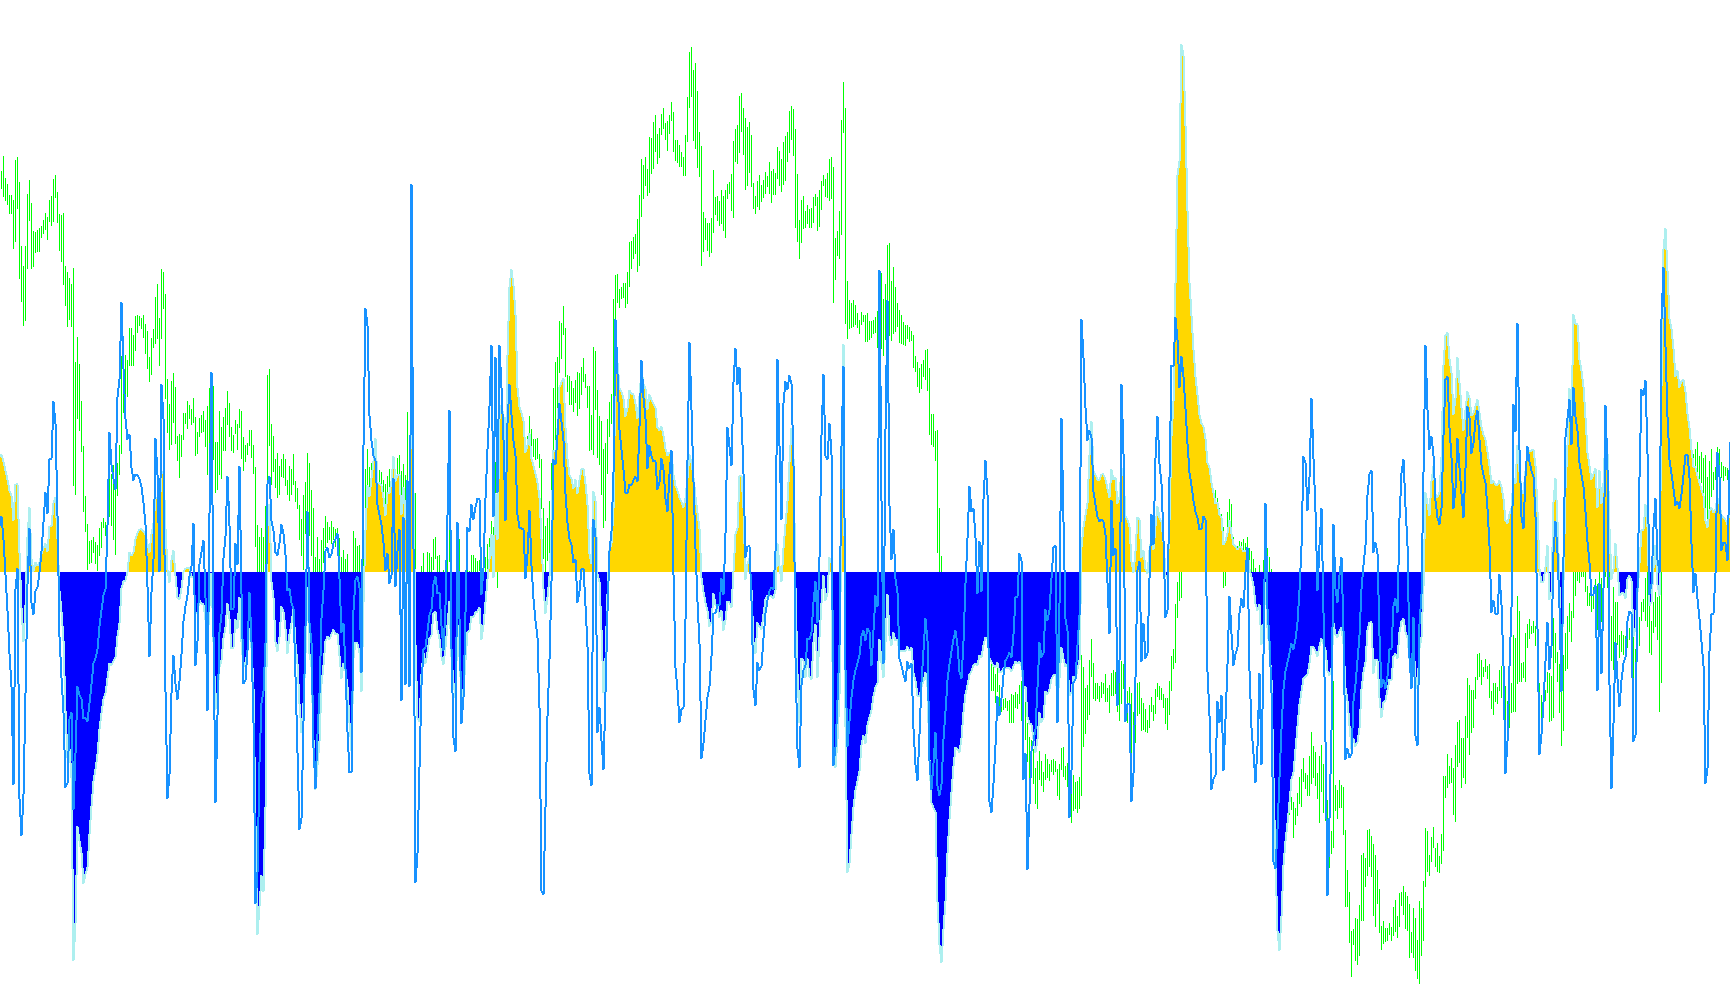
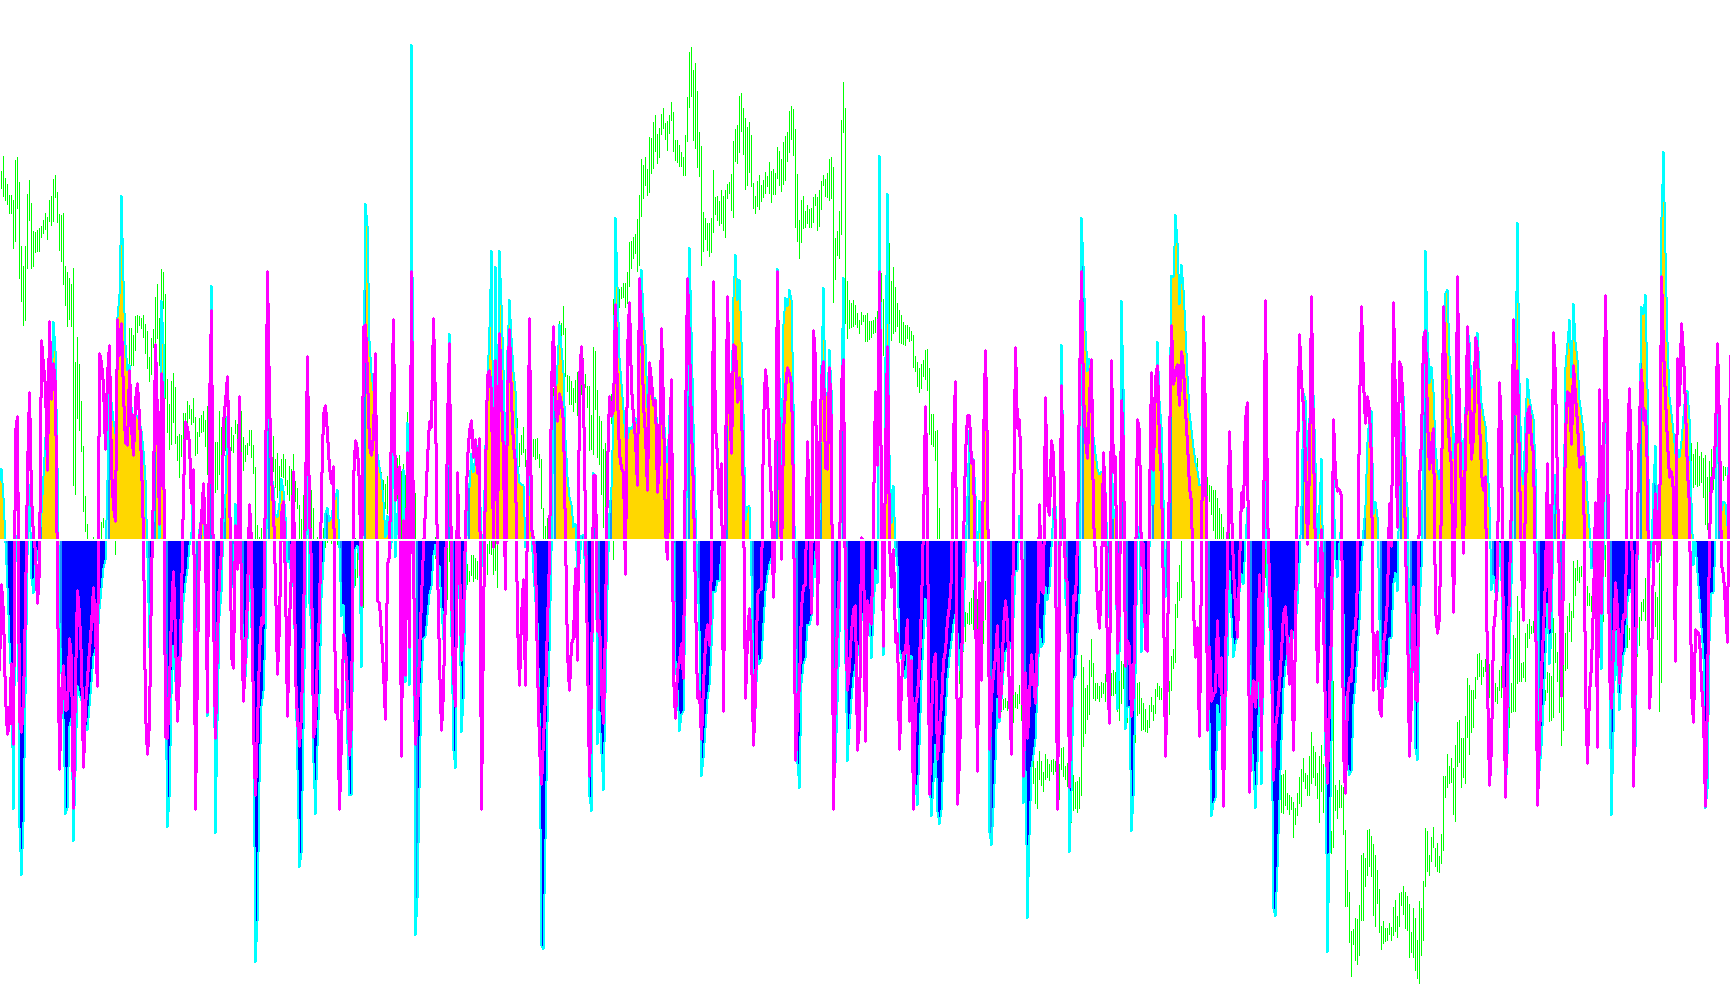
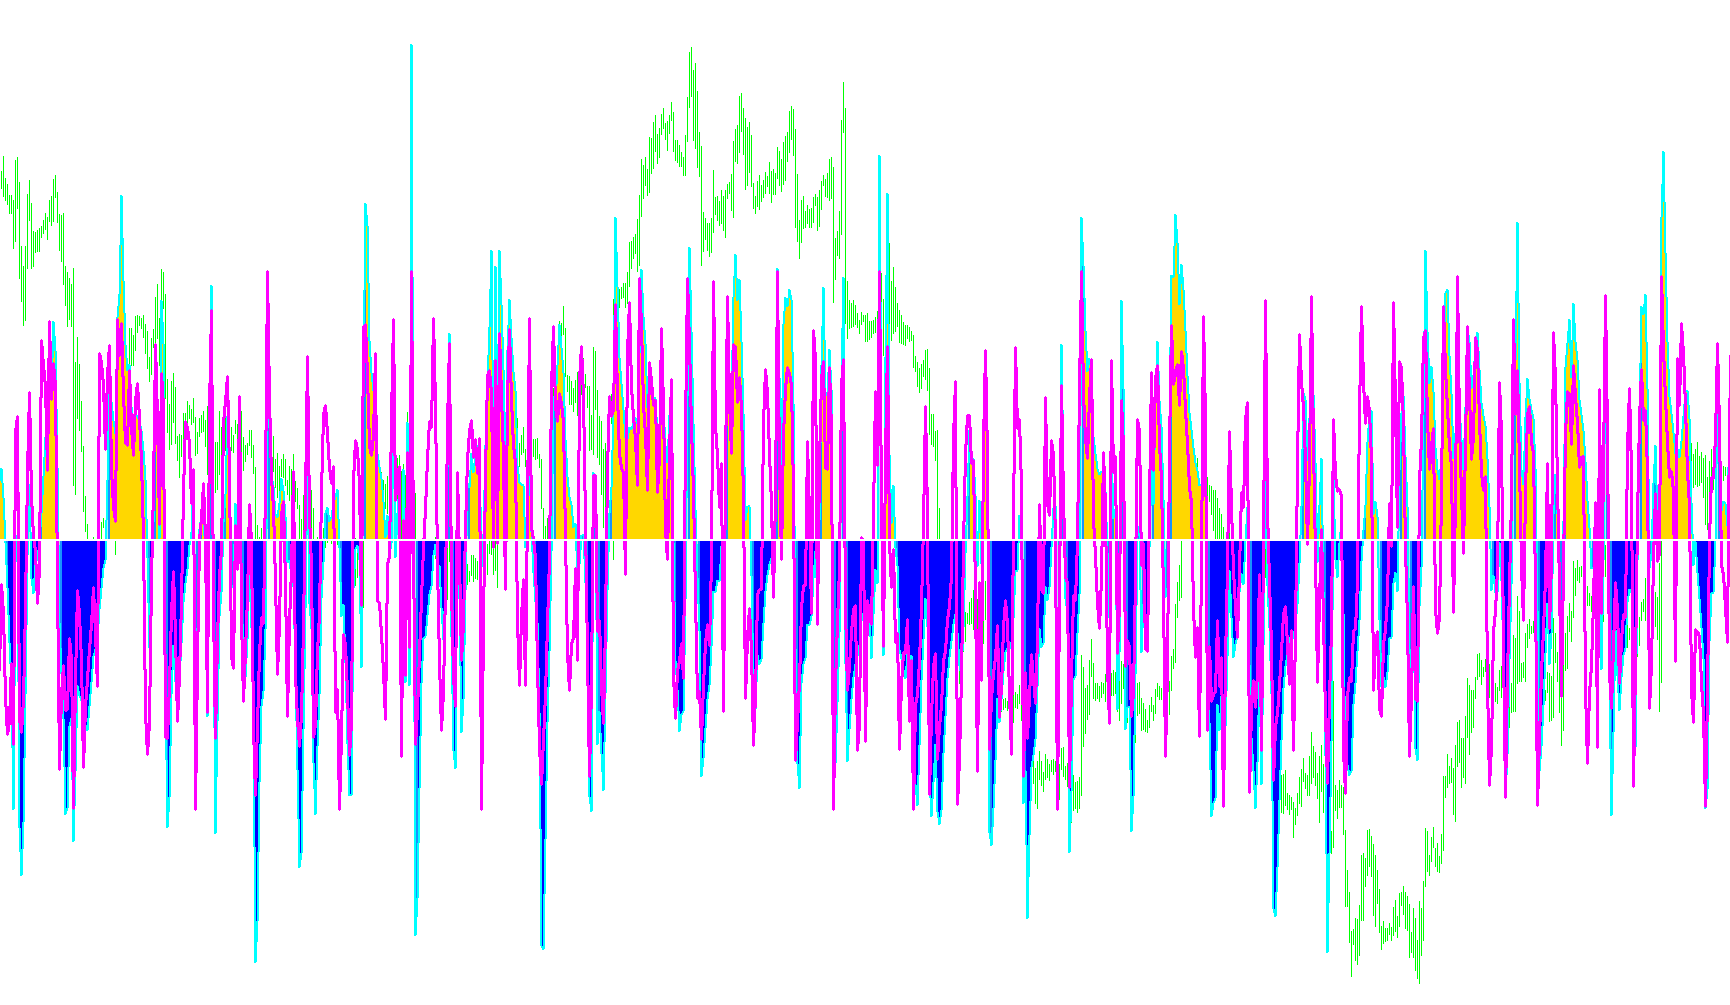
This indicator synthesizes a dual-CCI framework with smoothed LSMA filtering to identify trend structural shifts and momentum transitions via color-coded histogram states.

CCI_Woodies_Lnx_v5
Indicator

CCI_Woodies_Lnx_v5

iCCIiMA

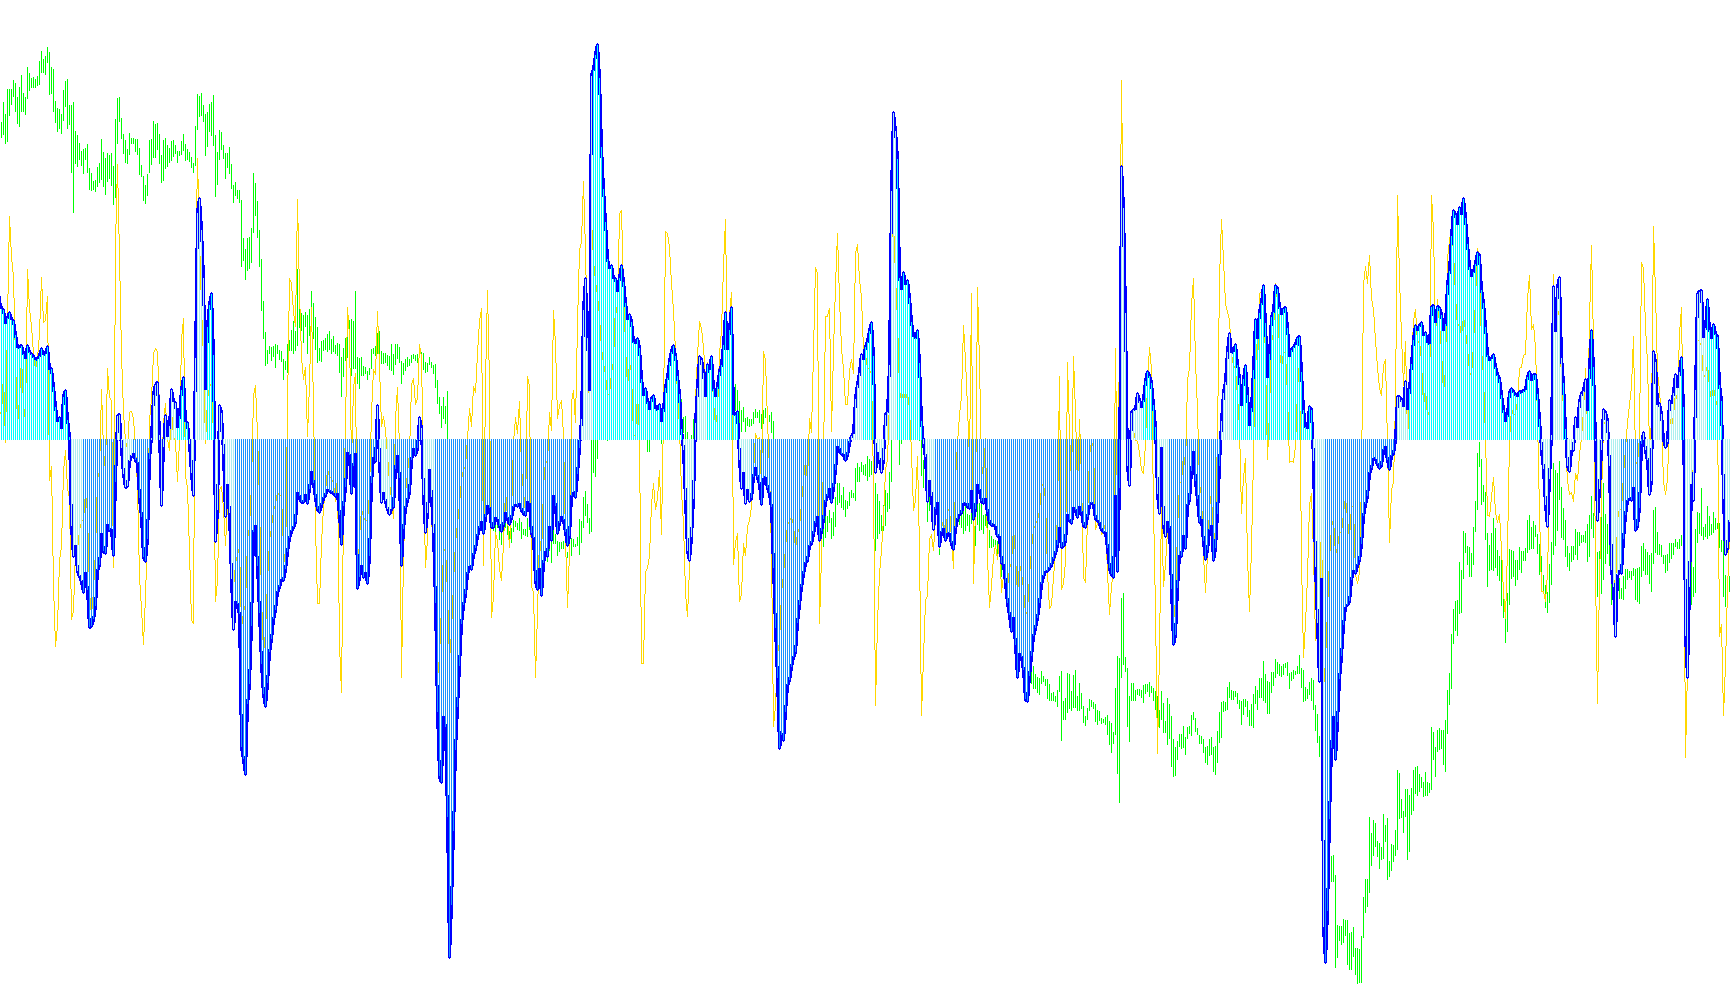
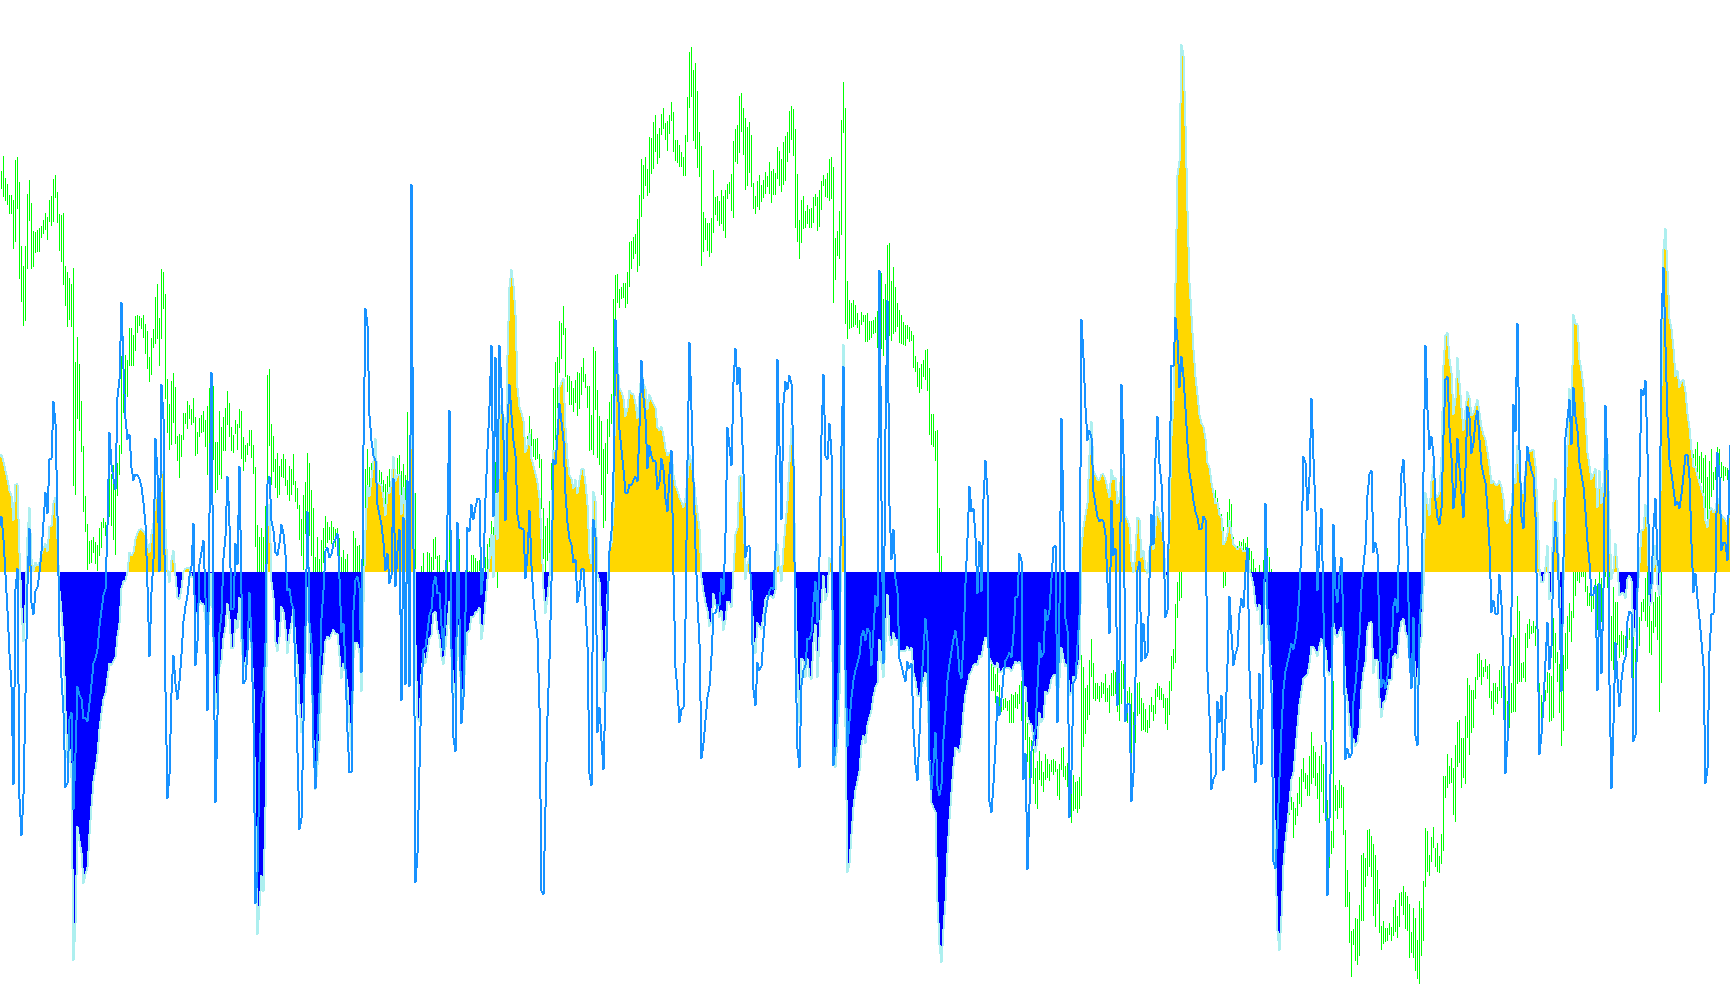
This indicator synchronizes multi-period Commodity Channel Index (CCI) histograms with Linear Scans and Exponential Moving Averages to identify trend shifts and price momentum extremes.

CCI_Woodies_Lnx_v6
Indicator

CCI_Woodies_Lnx_v6

iCCIiMA

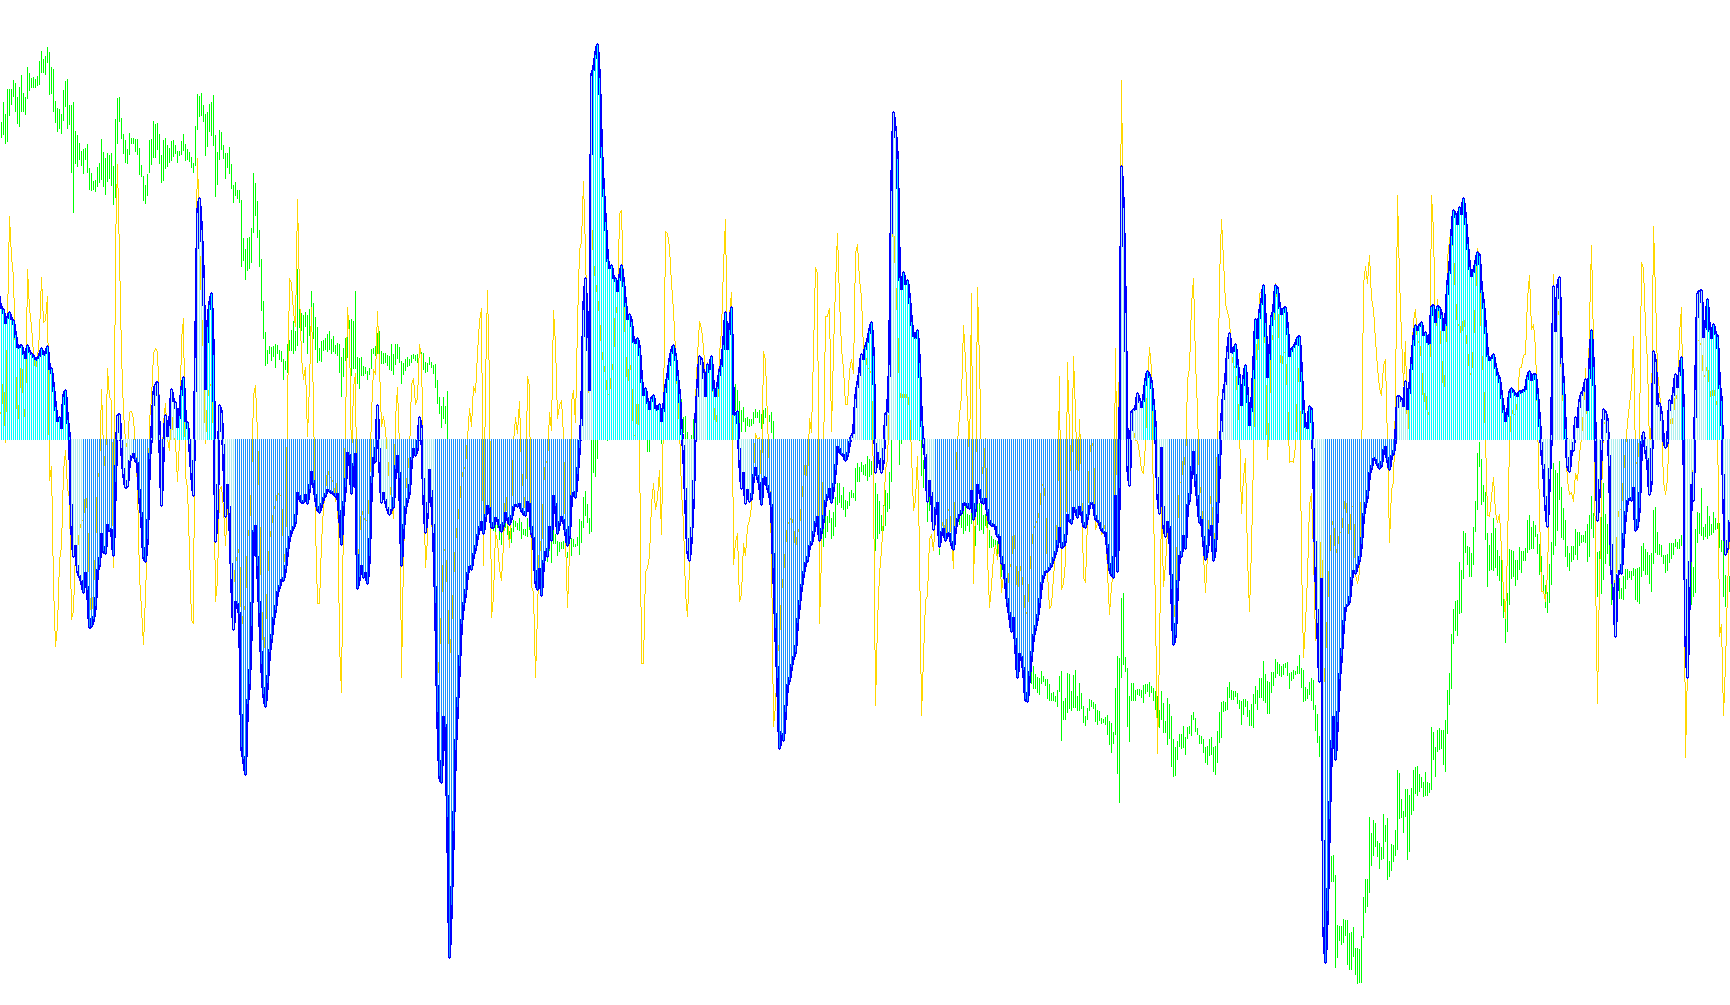
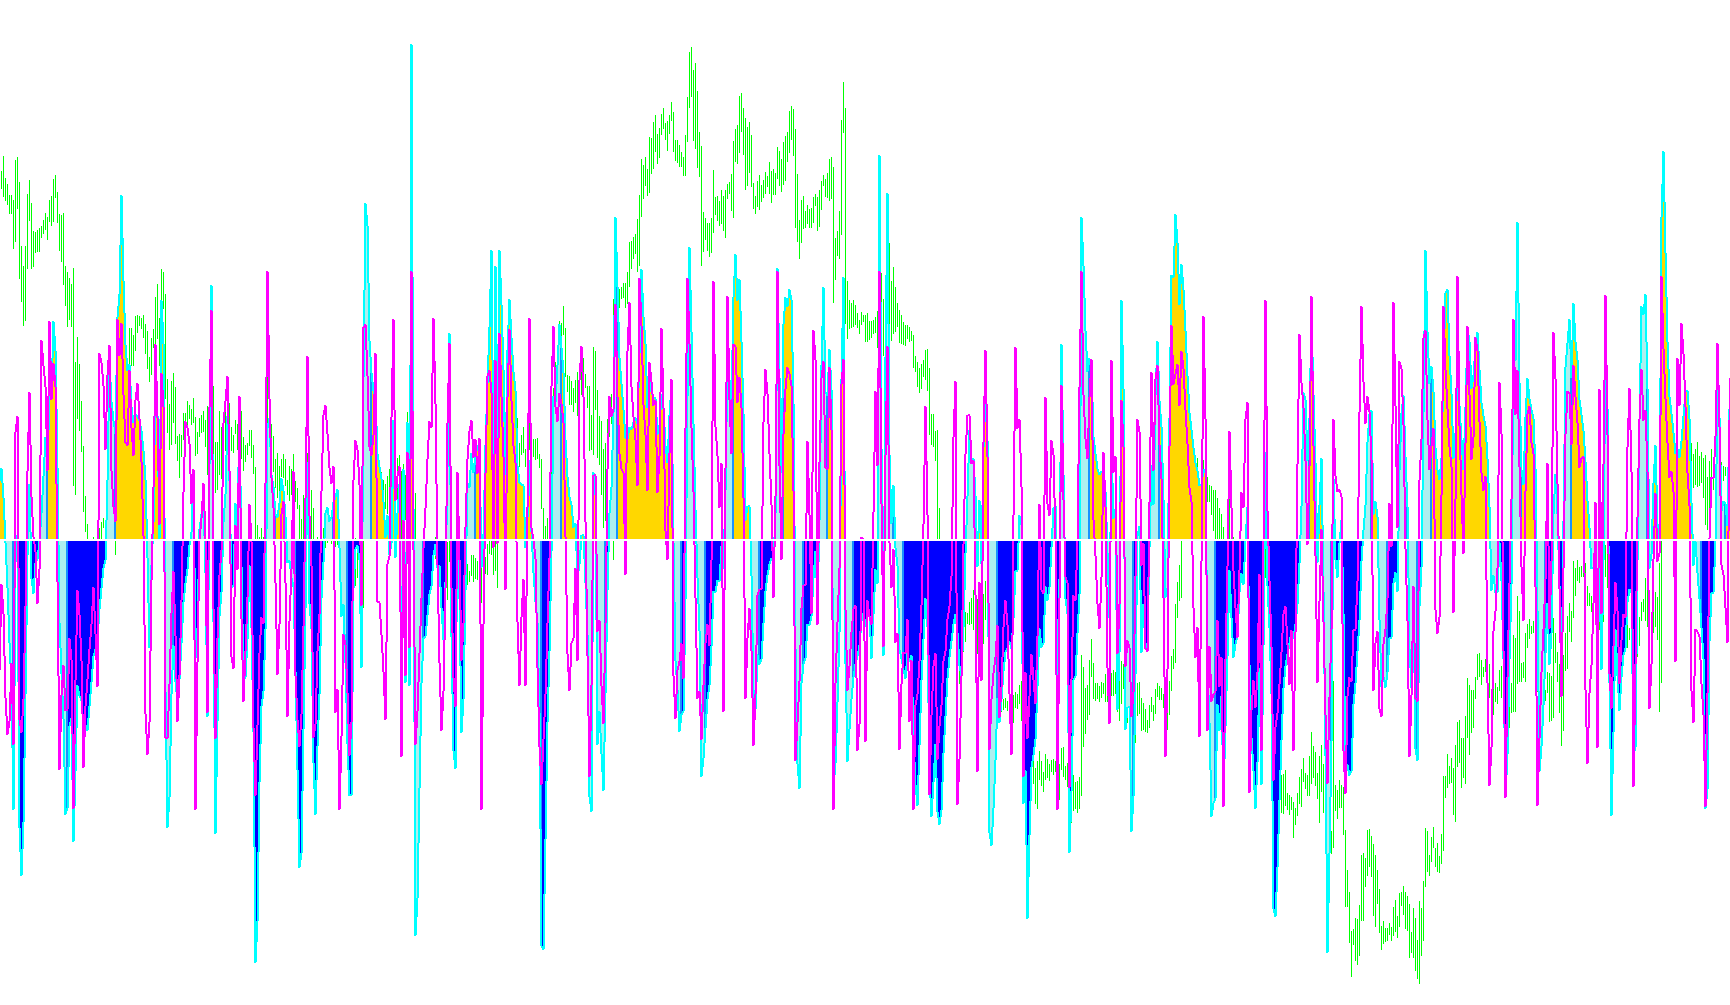
This indicator synthesizes Woodie-style logic by overlaying LSMA and EMA filters onto dual CCI periods to identify trend shifts through multi-colored histogram dynamics.

CCI_Woodies_Paterns_v1
Indicator

CCI_Woodies_Paterns_v1

iCCI

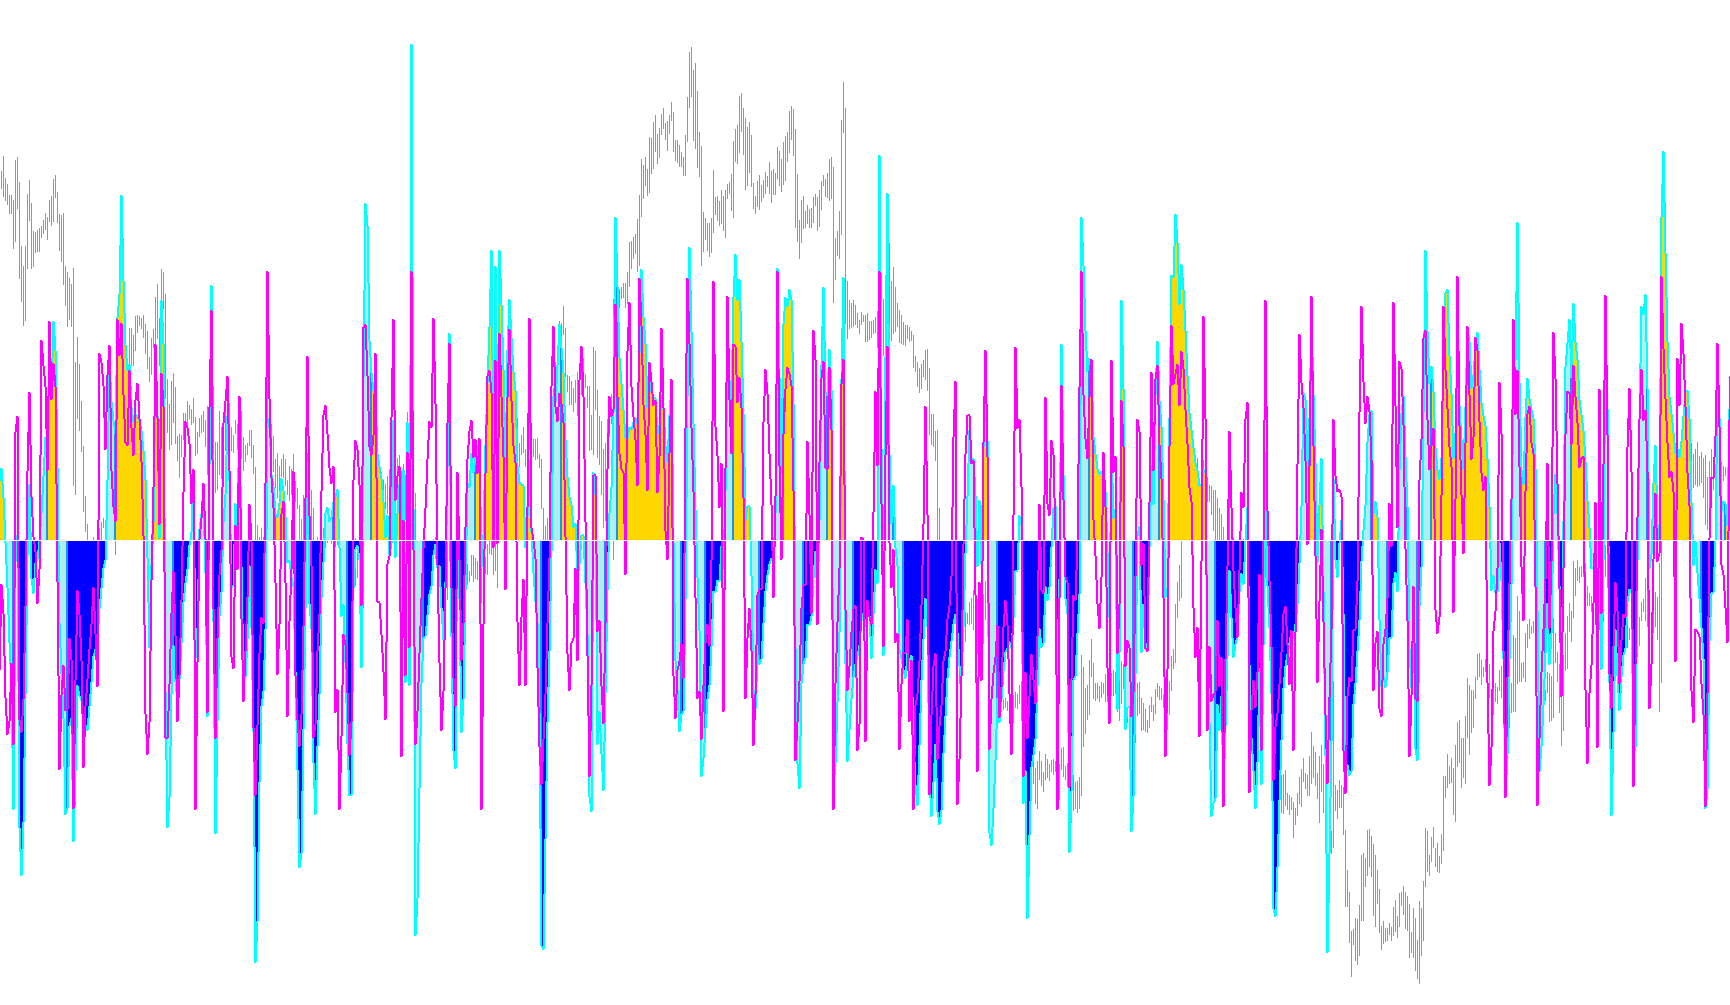
This indicator identifies complex trend reversals and continuation opportunities by detecting eight distinct price action patterns—including divergences, line breaks, and volatility hooks—based on the interaction of dual Commodity Channel Index (CCI) oscillators.

CCI_Woodies_v1
Indicator

CCI_Woodies_v1

iCCI

This indicator plots two distinct Commodity Channel Index (CCI) lines with varying periods to visualize divergent price momentum shifts relative to typical price averages.

CCI_Woodies_v2
Indicator

CCI_Woodies_v2

iCCI

This indicator plots two Commodity Channel Index (CCI) lines with different periods, allowing for the identification of potential divergence and convergence patterns.

CCI_Woodies_Valeo
Indicator

CCI_Woodies_Valeo

iCCIiMA
Indicator

CCI_Woodie_mtf

iCCIiMA
CheckMarkPattern_AD
Indicator

CheckMarkPattern_AD

iMACDiMomentumiRVIiRSI

This indicator identifies bullish and bearish patterns by detecting inverse price-to-oscillator extremums across multiple technical metrics.

Coloured Woodies CCI
Indicator

Coloured Woodies CCI

iCCI

This indicator identifies momentum shifts by calculating the differential between fast and slow Commodity Channel Index values, employing a neutral zone buffer to filter out minor price fluctuations.

ColouredWoodie
Indicator

ColouredWoodie

iCCI

This indicator identifies market sentiment by calculating the crossover and zero-line transitions of fast and slow Commodity Channel Index oscillators to visualize momentum shifts through color-coded histograms.

ColouredWoodiesCCI
Indicator

ColouredWoodiesCCI

iCCI
ColouredWoodiesCCI_v1
Indicator

ColouredWoodiesCCI_v1

iCCI

This indicator identifies directional shifts by comparing fast and slow Commodity Channel Index values, utilizing a neutral zone threshold to filter out market noise and highlight confirmed trend momentum through color-coded histograms.

ColouredWoodie_v1
Indicator

ColouredWoodie_v1

iCCI

This indicator calculates dual-period Commodity Channel Indices to identify trend reversals and momentum shifts through multi-colored histogram transitions.

ColouredWoodie_v2
Indicator

ColouredWoodie_v2

iCCI

This indicator synthesizes fast and slow Commodity Channel Index values to identify trend momentum and detect neutral territory via a color-coded histogram.

Commentator
Indicator

Commentator

iACiCCIiDeMarkeriATR
Commentator_v1
Indicator

Commentator_v1

iACiCCIiDeMarkeriATR
Commentator_v2
Indicator

Commentator_v2

iACiCCIiDeMarkeriATR
DDFX 8 Sentiment v3
Indicator

DDFX 8 Sentiment v3

iCCIiMA

This indicator identifies market bias by synchronizing Commodity Channel Index polarity with the directional slope of dual exponential moving average spreads.

divergencepetr_s7
Indicator

divergencepetr_s7

iADiACiATRiADX
Indicator

Divergence_Petr

iADiACiATRiADX
doji_arrows
Indicator

doji_arrows

iCCI

This indicator identifies potential trend reversals by detecting specific price action patterns where a neutral balance bar is followed by an expansion beyond its high or low boundaries.

doji_arrows_v1
Indicator

doji_arrows_v1

iCCI

Identifies potential trend reversals by detecting consecutive candle price action that pierces the previous period's high or low boundaries following a neutral equilibrium state.

doji_arrows_v2
Indicator

doji_arrows_v2

iCCI

This indicator detects trend reversals by identifying specific price action sequences where a neutral Doji candle is immediately followed by a breakout above its high or below its low.

DoubleCCI-With_EMA
Indicator

DoubleCCI-With_EMA

iCCIiMAOnArray
DoubleCCI-With_EMA_v1
Indicator

DoubleCCI-With_EMA_v1

iCCIiMAOnArray
DoubleCCI-With_SMAvbobslowVK
Indicator

DoubleCCI-With_SMAvbobslowVK

iCCIiMAOnArray

This indicator identifies trend momentum by correlating two separate Commodity Channel Index (CCI) periods with dynamic SMA smoothing and automated timeframe optimization.

DoubleCCI-With_SMAvbobslowVK_WithCrossAlert
Indicator

DoubleCCI-With_SMAvbobslowVK_WithCrossAlert

iCCIiMAOnArray

This indicator identifies market momentum by synchronizing dual-period Commodity Channel Index (CCI) values with a Simple Moving Average crossover and automated timeframe optimization.

DoubleCCI
Indicator

DoubleCCI

iCCI

This indicator synchronizes multi-timeframe aware trend and entry Commodity Channel Index (CCI) values to identify directional momentum shifts through dual zero-line crossovers.

DoublecciWoody
Indicator

DoublecciWoody

iCCI
DoublecciWoody_v1
Indicator

DoublecciWoody_v1

iCCI

This indicator analyzes trend strength by differentiating between primary and secondary CCI cycles to identify confirmed momentum shifts and zero-cross synchronization.

DoubleCCI_With_EMA_Email
Indicator

DoubleCCI_With_EMA_Email

iCCIiMAOnArray

This indicator identifies trend direction and potential entry points by analyzing the divergence between a long-period Trend CCI and a short-period Entry CCI, complemented by optional EMA smoothing and multi-timeframe adaptive logic.

doublecci_woodies
Indicator

doublecci_woodies

iCCI
DoubleCCI_Woodies_003
Indicator

DoubleCCI_Woodies_003

iCCI

This indicator identifies market bias by comparing a long-term trend CCI with a short-term entry CCI to detect momentum breakouts and structural shifts.

DoubleCCI_Woodies_v1
Indicator

DoubleCCI_Woodies_v1

iCCI

This indicator analyzes market direction by correlating long-period trend identification with short-period entry signals to filter high-probability momentum shifts.

DoubleCCI_Woodies_v2
Indicator

DoubleCCI_Woodies_v2

iCCI

This indicator identifies directional momentum by correlating a long-period trend oscillator with a short-period entry signal to filter out noise and confirm sustained market moves.

DoubleCCI_Woodies_v4
Indicator

DoubleCCI_Woodies_v4

iCCI

This indicator identifies long-term market bias using a primary trend CCI while monitoring short-term momentum oscillations to pinpoint precise entry cycles.

DTS-InfoTrade
Indicator

DTS-InfoTrade

iCCIiMACDiRSIiStochastic
Indicator

Elliott Wave indic

iBearsPoweriBullsPoweriCCIiRSI
Indicator

Elliott Wave indic_v1

iBearsPoweriBullsPoweriCCIiRSI
EWOCCI_Indicator.2
Indicator

EWOCCI_Indicator.2

iCCIiMA

This indicator generates buy/sell signals based on the crossover of the CCI around zero and the sign of the Elliot Wave Oscillator (EWO), signaling potential trend changes.

EWOCCI_Indicator.2_v1
Indicator

EWOCCI_Indicator.2_v1

iCCIiMA

This indicator identifies high-probability trend reversals by detecting concurrent momentum shifts between the Elliot Wave Oscillator (EWO) and the Commodity Channel Index (CCI) filtered by daily price pivots.

EWOCCI_Indicator
Indicator

EWOCCI_Indicator

iCCIiMA

This indicator identifies trend reversals by detecting simultaneous zero-crossings in the Commodity Channel Index and the Elliot Wave Oscillator while filtering for momentum via moving average spreads.

EWOCCI_Indicator_v1
Indicator

EWOCCI_Indicator_v1

iCCIiMA

This indicator identifies potential reversals by detecting simultaneous zero-crossings of the Commodity Channel Index (CCI) and the Elliot Wave Oscillator (EWO), filtered by momentum divergence.

FerruFx_Multi_info THV
Indicator

FerruFx_Multi_info THV

iCCIiMACDiADXiMA
FerruFx_Multi_info+
Indicator

FerruFx_Multi_info+

iCCIiMACDiADXiMA

This indicator synthesizes real-time trend data from moving averages, CCI, MACD, ADX, and Bulls/Bears power across multiple timeframes to provide a comprehensive visual heat map of market sentiment and trade statistics.

FerruFx_Multi_info+_light_chart_v1.1
Indicator

FerruFx_Multi_info+_light_chart_v1.1

iCCIiMACDiADXiMA
FerruFx_Multi_info+_light_chart_v1.1_001
Indicator

FerruFx_Multi_info+_light_chart_v1.1_001

iCCIiMACDiADXiMA
FerruFx_Multi_info+_light_chart_v1[1].1-Ndisc
Indicator

FerruFx_Multi_info+_light_chart_v1[1].1-Ndisc

iCCIiMACDiADXiMA
FerruFx_Multi_info+_v1[1].2
Indicator

FerruFx_Multi_info+_v1[1].2

iCCIiMACDiADXiMA

This indicator provides a customizable dashboard displaying account information and aggregated trend analysis from multiple indicators across various timeframes, allowing traders to quickly assess market direction.