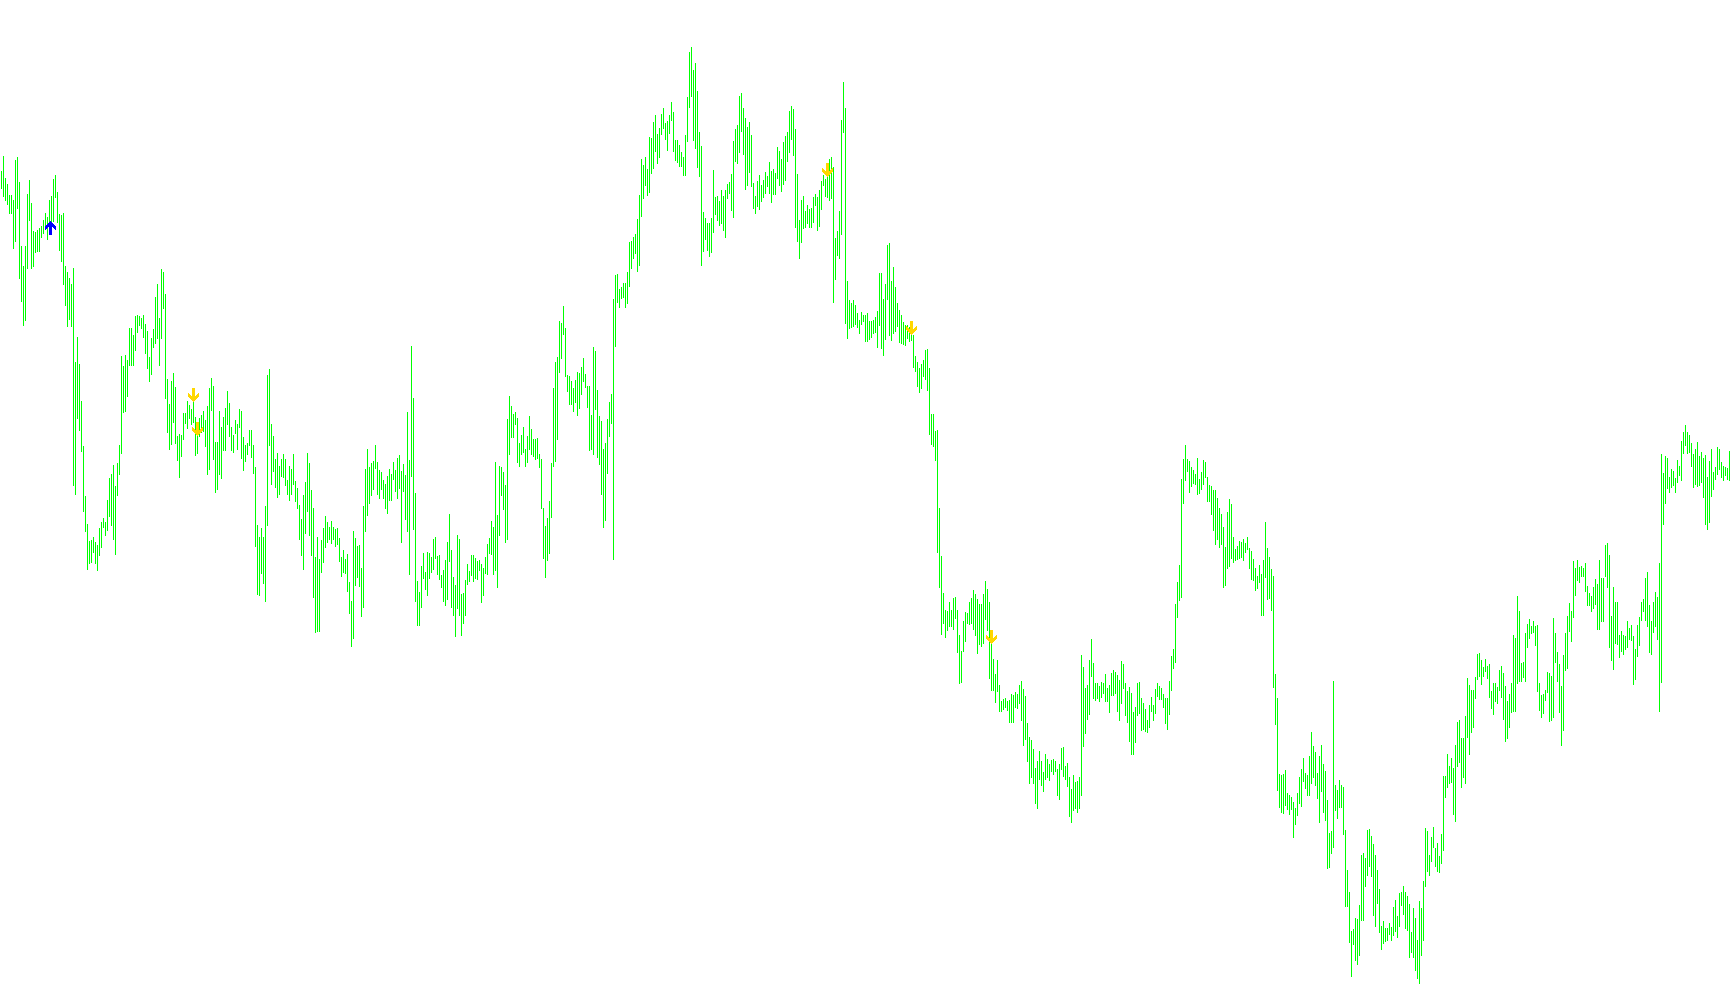
This technical indicator is designed to identify specific price action patterns on a trading chart by scanning historical data and signaling potential market shifts. Instead of relying on complex mathematical formulas, it focuses on the visual behavior of "Doji" candles—a specific type of candlestick where the opening and closing prices are virtually identical.
Core Logic and Detection
The script monitors the relationship between three consecutive price bars to determine market sentiment:
- Buy Signal Identification: The logic looks for a "neutral" bar (where the open and close are equal) followed immediately by a bar that breaks above the high of that neutral bar. When this specific sequence occurs, it registers as a potential upward momentum shift.
- Sell Signal Identification: Conversely, the script looks for a "neutral" bar followed immediately by a bar that breaks below the low of that neutral bar. This sequence is interpreted as a potential downward momentum shift.
Visual Feedback
To make these signals actionable for a trader, the indicator places visual markers directly on the chart:
- Red Arrows: These appear above the high of a candle to signal a potential "Sell" opportunity based on the downward break logic.
- Blue Arrows: These appear below the low of a candle to signal a potential "Buy" opportunity based on the upward break logic.
Performance and Behavior
- Historical Scanning: The tool is configured to analyze a large window of historical data (up to 2,000 bars), allowing traders to see where these patterns occurred in the past to verify their reliability.
- State Tracking: The script includes internal logic to ensure it only signals the first time a pattern occurs. This prevents "signal fatigue" by ensuring that once a trend is identified, it doesn't keep printing arrows on every subsequent bar until the trend changes.
- Real-Time Updates: The script is designed to update automatically as new price data arrives, providing a dynamic look at current market conditions.
Indicators Used
Miscellaneous
15
Views
0
Downloads
0
Favorites
doji_arrows_v1
/*-----------------------------+
|			       |
| Shared by www.Aptrafx.com    |
|			       |
+------------------------------*/

//+------------------------------------------------------------------+
//| Doji Arrows
//|
//+------------------------------------------------------------------+

#property indicator_chart_window
#property indicator_buffers 4
#property indicator_color1 Red
#property indicator_color2 Blue
#property indicator_color3 Blue
#property indicator_color4 Red

datetime BarTime;
//---- input parameters
//extern int RISK=3;
extern double thresholdB=0.0001;
extern double thresholdS=-0.0001;
extern int SSP=9;
extern int CountBars=2000;

//---- buffers
double val1[];
double val2[];
double val3[];
double val4[];
double red0,red1,red2;
double blue0,blue1,blue2;
double cci0,cci1,rsi0,dpo0,dpo1;
double plusdi,minusdi,main;

//+------------------------------------------------------------------+
//| Custom indicator initialization function                         |
//+------------------------------------------------------------------+

int init()
  {
   string short_name;
//---- indicator line
   IndicatorBuffers(4);
   SetIndexStyle(0,DRAW_ARROW);
   SetIndexArrow(0,234);

   SetIndexStyle(1,DRAW_ARROW);
   SetIndexArrow(1,233);

   SetIndexStyle(2,DRAW_ARROW);
   SetIndexArrow(2,253);

   SetIndexStyle(3,DRAW_ARROW);
   SetIndexArrow(3,253);

   SetIndexBuffer(0,val1);
   SetIndexBuffer(1,val2);
   SetIndexBuffer(2,val3);
   SetIndexBuffer(3,val4);

//----
   return(0);
  }
//+------------------------------------------------------------------+
//| Doji Arrows                                                   |
//+------------------------------------------------------------------+
int start()
  {

   if(BarTime == Time[0]) {return(0);}
   //new bar, update bartime
   BarTime = Time[0];


SetIndexDrawBegin(0,Bars-CountBars+SSP+1);
   SetIndexDrawBegin(1,Bars-CountBars+SSP+1);
   int i,counted_bars=IndicatorCounted();
   int K;
   bool uptrend,downtrend,ExitBuy,ExitSell,old,old2,old3,old4;

//----
   if(Bars<=SSP+1) return(0);
//---- initial zero
   if(counted_bars<SSP+1)

   {
      for(i=1;i<=0;i++) val1[CountBars-i]=0.0;
      for(i=1;i<=0;i++) val2[CountBars-i]=0.0;
      for(i=1;i<=0;i++) val3[CountBars-i]=0.0;
      for(i=1;i<=0;i++) val4[CountBars-i]=0.0;
   }
//----
   i=CountBars-SSP-1;

   while(i>=0)
     {

      //dpo1=iCustom(NULL,0,"DPO",7,800,0,i+1);

      val1[i]=0.0;
      val2[i]=0.0;
      val3[i]=0.0;
      val4[i]=0.0;

////////////////////////////////////////////////////////////////////////////////////////////////
////////////////////////////////////////////////////////////////////////////////////////////////

   //buy signal
   if ((Close[i+2] == Open[i+2]) &&
      (Close[i+1]>High[i+2]) /*&&
      (iCCI(NULL,0,14,PRICE_CLOSE,i)>100)*/)
      uptrend=true; //else uptrend=false;
   if ((!(Close[i+2] == Open[i+2])) &&
      (!(Close[i+1]>High[i+2])))
      uptrend=false;
   if ((! uptrend==old) && (uptrend==true))
      {
      //PlaySound("alert.wav");
      val2[i]=Low[i]-5*Point;
      //Alert(TimeMonth(CurTime()),"/",TimeDay(CurTime())," at ",TimeHour(CurTime()),":",TimeMinute(CurTime()),"   -   Possible buy on ",Symbol()," ", Period());
      }

/////////////////////////////////////////////////////////////////////////////////////////////////
/////////////////////////////////////////////////////////////////////////////////////////////////

   //sell signal
  if ((Close[i+2] == Open[i+2]) &&
      (Close[i+1]<Low[i+2]) /*&&
      (iCCI(NULL,0,14,PRICE_CLOSE,i)<-100)*/)
      downtrend=true; //else downtrend=false;
   if ((!(Close[i+2] == Open[i+2])) &&
      (!(Close[i+1]<Low[i+2])))
    downtrend=false;
   if ((! downtrend==old2) && (downtrend==true))
      {
      //PlaySound("alert.wav");
      val1[i]=High[i]+5*Point;
      //Alert(TimeMonth(CurTime()),"/",TimeDay(CurTime())," at ",TimeHour(CurTime()),":",TimeMinute(CurTime()),"   -   Possible buy on ",Symbol()," ", Period());
      }
///////////////////////////////////////////////////////////////////////////////////////////////////
///////////////////////////////////////////////////////////////////////////////////////////////////

   old=uptrend;
   old2=downtrend;
   old3=ExitBuy;
   old4=ExitSell;

      i--;

     }
   return(0);
  }

//+------------------------------------------------------------------+
Comments