doji_arrows_v2
Download script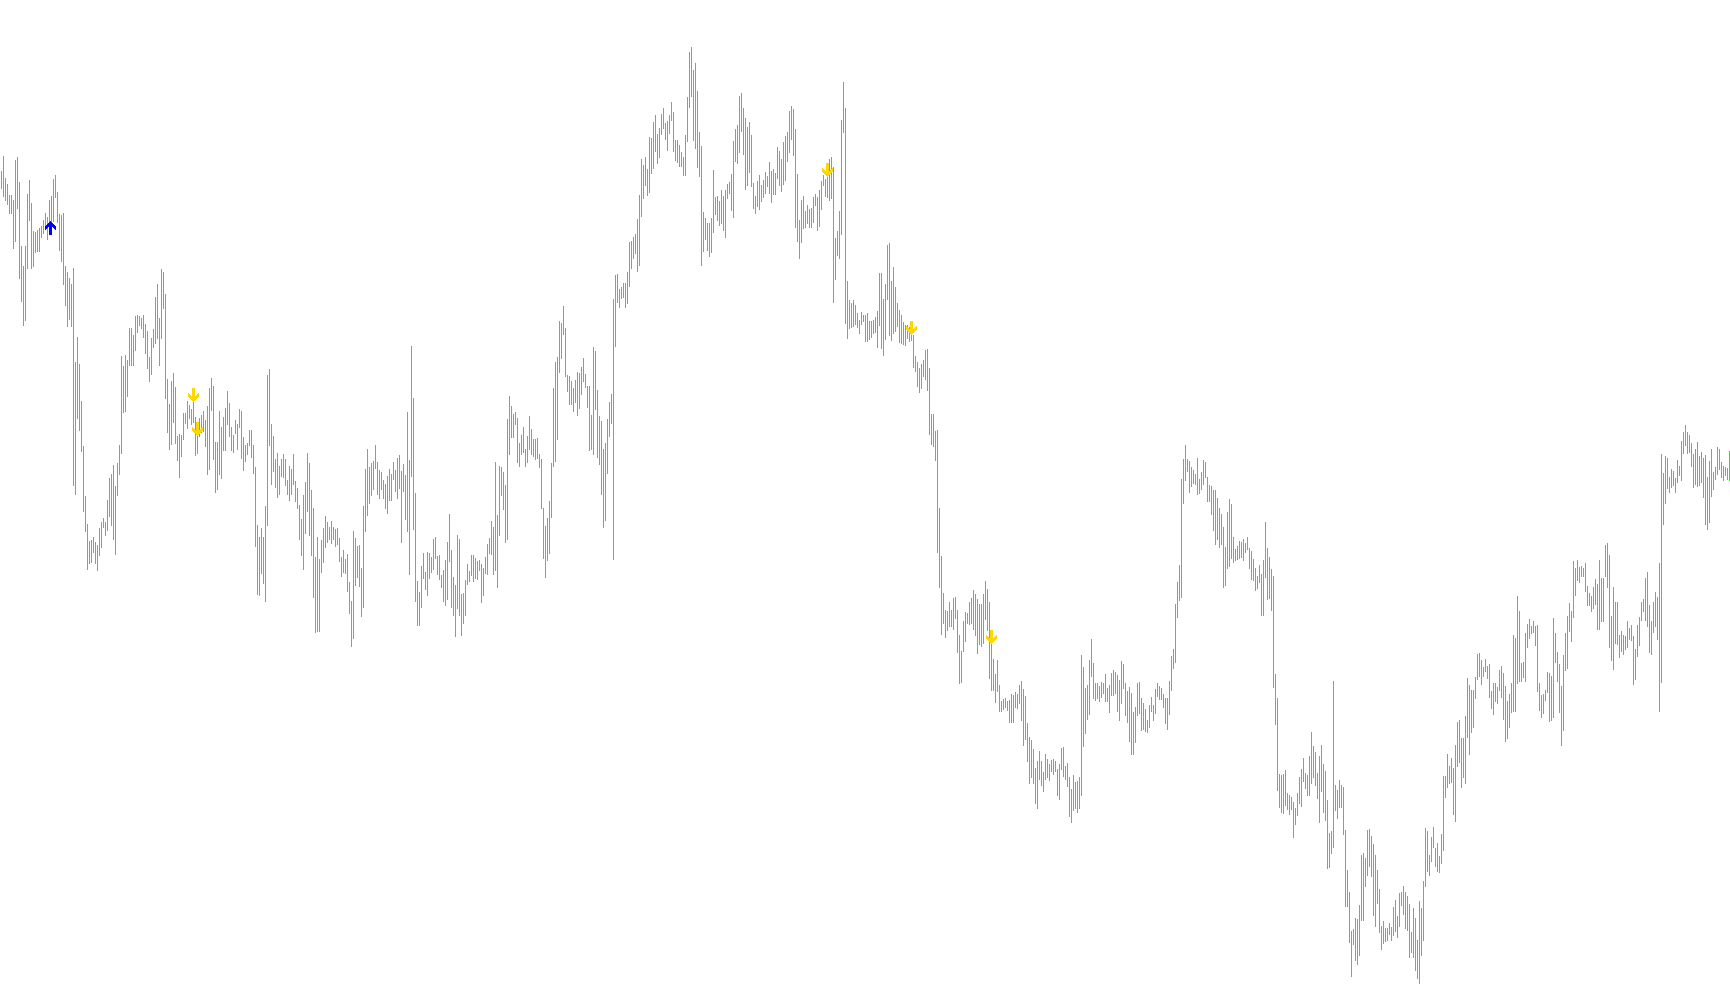
This tool is designed to identify potential turning points in the market by analyzing specific price action patterns, specifically focusing on "Doji" candles—which represent moments of equilibrium where buying and selling pressures are balanced.
How the Logic Works
The script scans historical price data to detect transitions between different market trends. It looks for a sequence of price movements that suggest a shift in momentum:
1. Identifying Buy Opportunities (Uptrend Signals) The logic searches for a specific three-candle formation:
- It identifies a Doji candle (where the opening and closing prices are equal).
- It then checks if the very next price movement breaks significantly above the previous candle's high.
- When this specific "breakout" occurs immediately following a period of balance (the Doji), the script recognizes it as a potential shift into an upward trend and places a visual indicator on the chart.
2. Identifying Sell Opportunities (Downtrend Signals) Similarly, the tool looks for the opposite behavior to identify selling pressure:
- It identifies a Doji candle.
- It then checks if the subsequent price movement breaks significantly below the previous candle's low.
- This combination suggests that the market has shifted from a state of balance into a downward move, triggering a corresponding visual indicator.
Key Features for the User
- Visual Alerts: Instead of making you guess where the trend is shifting, the script places clear arrows directly on your chart to highlight these specific price actions in real-time as they occur.
- Trend Tracking: The logic maintains a "memory" of the current trend state. It only triggers a signal at the exact moment the trend flips (e.g., from neutral/down to up), preventing the chart from being cluttered with repetitive signals during a sustained move.
- Customizable Sensitivity: You can adjust settings such as the look-back period and specific price thresholds to tune how the script perceives these movements based on your preferred trading style.
In essence, this tool automates the tedious work of watching every candle for balanced price action and subsequent breakouts, highlighting only the moments where the market shows a high probability of changing direction.
//+------------------------------------------------------------------+
//| Doji Arrows                                                      |
//|                                                                  |
//+------------------------------------------------------------------+
#property indicator_chart_window
#property indicator_buffers 4
#property indicator_color1 Red
#property indicator_color2 Blue
#property indicator_color3 Blue
#property indicator_color4 Red
//----
datetime BarTime;
//---- input parameters
//extern int RISK=3;
extern double thresholdB=0.0001;
extern double thresholdS=-0.0001;
extern int SSP=9;
extern int CountBars=2000;
//---- buffers
double val1[];
double val2[];
double val3[];
double val4[];
double red0,red1,red2;
double blue0,blue1,blue2;
double cci0,cci1,rsi0,dpo0,dpo1;
double plusdi,minusdi,main;
//+------------------------------------------------------------------+
//| Custom indicator initialization function                         |
//+------------------------------------------------------------------+
int init()
  {
   string short_name;
//---- indicator line
   IndicatorBuffers(4);
   SetIndexStyle(0,DRAW_ARROW);
   SetIndexArrow(0,234);
   SetIndexStyle(1,DRAW_ARROW);
   SetIndexArrow(1,233);
   SetIndexStyle(2,DRAW_ARROW);
   SetIndexArrow(2,253);
   SetIndexStyle(3,DRAW_ARROW);
   SetIndexArrow(3,253);
   SetIndexBuffer(0,val1);
   SetIndexBuffer(1,val2);
   SetIndexBuffer(2,val3);
   SetIndexBuffer(3,val4);
//----
   return(0);
  }
//+------------------------------------------------------------------+
//| Doji Arrows                                                   |
//+------------------------------------------------------------------+
int start()
  {
   if(BarTime==Time[0]) {return(0);}
   //new bar, update bartime
   BarTime=Time[0];
//----
   SetIndexDrawBegin(0,Bars-CountBars+SSP+1);
   SetIndexDrawBegin(1,Bars-CountBars+SSP+1);
   int i,counted_bars=IndicatorCounted();
   int K;
   bool uptrend,downtrend,ExitBuy,ExitSell,old,old2,old3,old4;
//----
   if(Bars<=SSP+1) return(0);
//---- initial zero
   if(counted_bars<SSP+1)
     {
      for(i=1;i<=0;i++) val1[CountBars-i]=0.0;
      for(i=1;i<=0;i++) val2[CountBars-i]=0.0;
      for(i=1;i<=0;i++) val3[CountBars-i]=0.0;
      for(i=1;i<=0;i++) val4[CountBars-i]=0.0;
     }
//----
   i=CountBars-SSP-1;
//----
   while(i>=0)
     {
      //dpo1=iCustom(NULL,0,"DPO",7,800,0,i+1);
      val1[i]=0.0;
      val2[i]=0.0;
      val3[i]=0.0;
      val4[i]=0.0;
      //buy signal
      if ((Close[i+2]==Open[i+2]) &&
      (Close[i+1]>High[i+2]) /*&&
      (iCCI(NULL,0,14,PRICE_CLOSE,i)>100)*/)
         uptrend=true; //else uptrend=false;
      if ((!(Close[i+2]==Open[i+2])) &&
         (!(Close[i+1]>High[i+2])))
         uptrend=false;
      if ((! uptrend==old) && (uptrend==true))
        {
         //PlaySound("alert.wav");
         val2[i]=Low[i]-5*Point;
         //Alert(TimeMonth(CurTime()),"/",TimeDay(CurTime())," at ",TimeHour(CurTime()),":",TimeMinute(CurTime()),"   -   Possible buy on ",Symbol()," ", Period());
        }
      //sell signal
      if ((Close[i+2]==Open[i+2]) &&
      (Close[i+1]<Low[i+2]) /*&&
      (iCCI(NULL,0,14,PRICE_CLOSE,i)<-100)*/)
         downtrend=true; //else downtrend=false;
      if ((!(Close[i+2]==Open[i+2])) &&
         (!(Close[i+1]<Low[i+2])))
         downtrend=false;
      if ((! downtrend==old2) && (downtrend==true))
        {
         //PlaySound("alert.wav");
         val1[i]=High[i]+5*Point;
         //Alert(TimeMonth(CurTime()),"/",TimeDay(CurTime())," at ",TimeHour(CurTime()),":",TimeMinute(CurTime()),"   -   Possible buy on ",Symbol()," ", Period());
        }
      old=uptrend;
      old2=downtrend;
      old3=ExitBuy;
      old4=ExitSell;
      i--;
     }
   return(0);
  }
//+------------------------------------------------------------------+
Comments