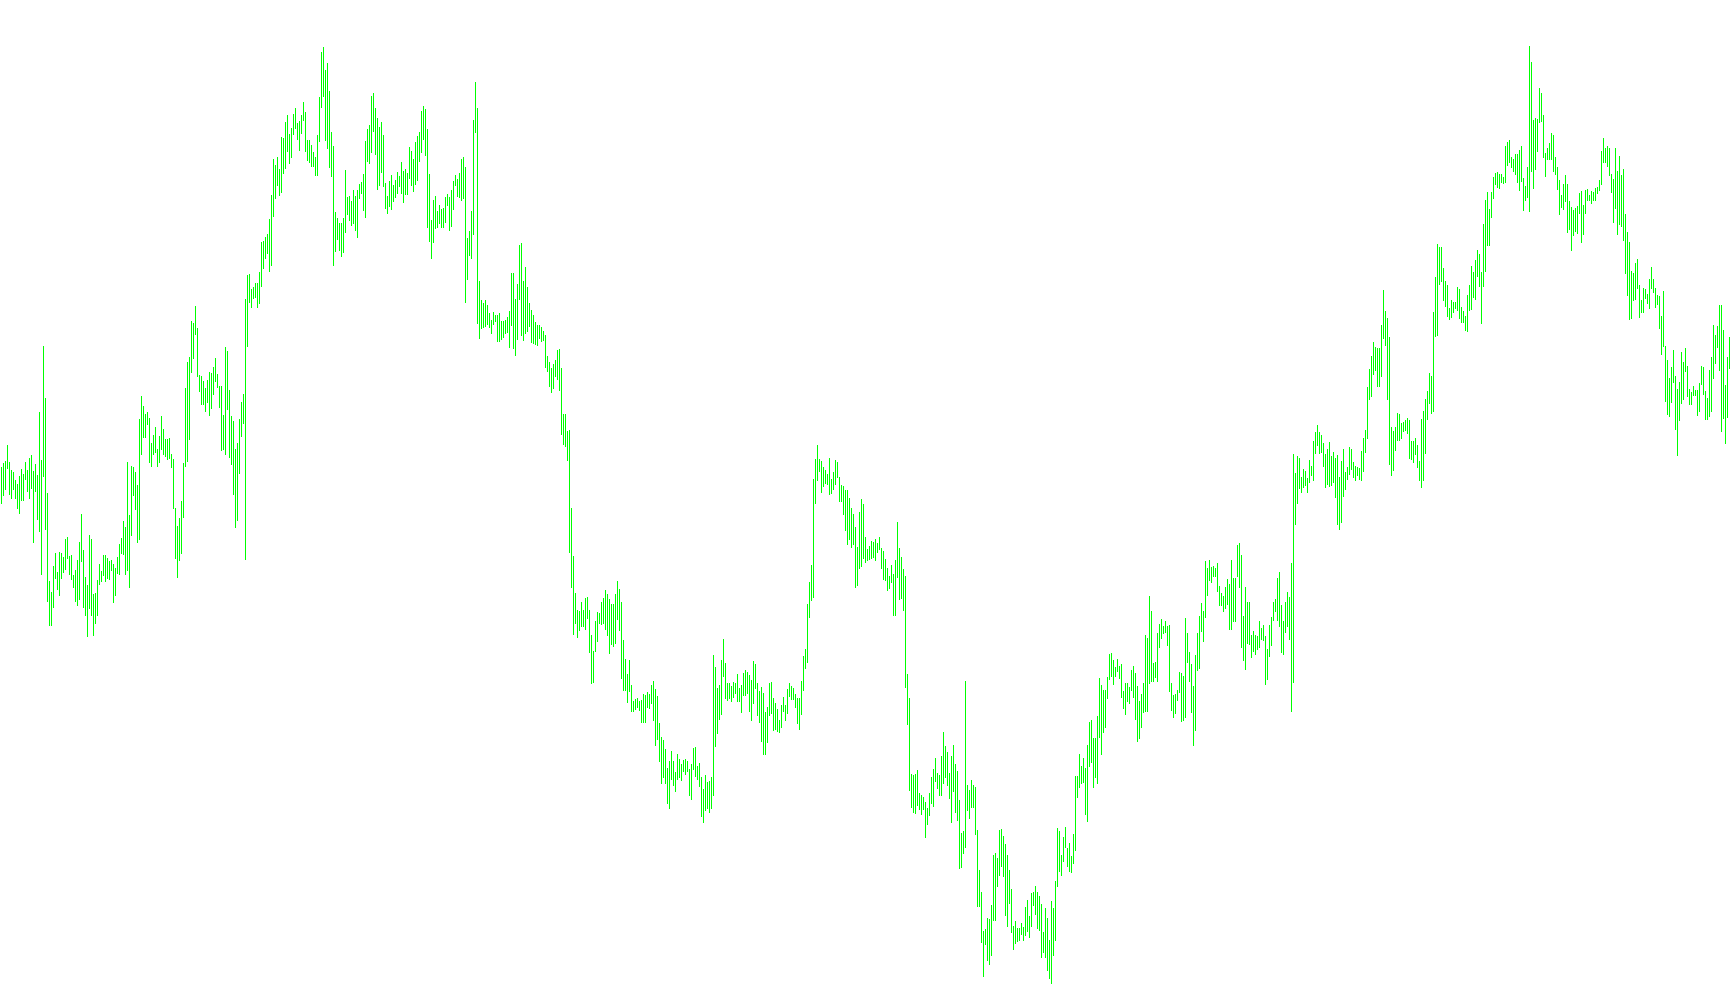
This tool is designed to transform standard market indicators into a "normalized" format. In simple terms, it takes the raw data from another indicator you already use and refines it so that its movements are easier to read, more consistent, and less influenced by extreme price spikes or erratic volatility.
How the Logic Works
1. Dynamic Data Processing The script begins by analyzing the history of your chosen base indicator. It specifically looks for "zero-crossings"—moments where the indicator flips from a positive value to a negative value (or vice versa). By counting how frequently these flips occur, the tool automatically calculates a "characteristic period." This allows the tool to adapt itself to different markets; it figures out the natural rhythm of the asset you are trading rather than using a rigid, one-size-fits-all setting.
2. Statistical Smoothing (Standard Deviation) Once it understands the market's rhythm, the script looks at the recent movement of the indicator over that calculated period. It calculates the standard deviation, which is a mathematical way of measuring how much the price "swings" away from its average. By dividing the current indicator value by this standard deviation, the tool "evens out" the data. This means that huge, outlier spikes are dampened, while smaller, significant movements remain visible.
3. Signal Compression (The Tanh Function)
To ensure the final result is clean and easy to interpret on a chart, the script applies a mathematical compression known as a Tangent Hyperbolic function (MathTanh).
This does two important things:
- It keeps the data within a predictable range (generally between -1 and 1).
- It creates a smooth, curved transition in the lines. Instead of sharp, jagged angles, the movements become more fluid, making it much easier for a trader to identify the overall trend or momentum at a glance.
Summary for the User
Think of this script as a "filter" for your trading tools. It takes a raw, potentially messy indicator and cleans it up by:
- Automatically detecting the speed of market changes.
- Scaling down extreme volatility so it doesn't overwhelm your view.
- Smoothing out the visual line to highlight the true direction of the trend.
//+------------------------------------------------------------------+
//|                                                   Normalizer.mq4 |
//|                                          Copyright © 2008, al_su |
//|                                                  al_su31@mail.ru |
//+------------------------------------------------------------------+
#property copyright "Copyright © 2008, al_su"
#property link      "al_su31@mail.ru"

#property indicator_separate_window
#property indicator_buffers 1
#property indicator_maximum 1
#property indicator_minimum -1
#property indicator_level1 0.25
#property indicator_level2 0.5
#property indicator_level3 0.75
#property indicator_level4 -0.25
#property indicator_level5 -0.5
#property indicator_level6 -0.75
#property indicator_color1 DodgerBlue
//---- input parameters
#define PERIODS_CHARACTERISTIC 3

extern string  Indicator;
extern int     mode=0;
extern int     param1=8;//Íó èëè 9, íå âàæíî...
extern int     param2=9;
//extern int param3;Ñêîêà íàäî ïàðàìåòðîâ, ñòîêà è çàäàåì

//---- buffers
double Normalizer[];
double characteristic_period;
double sigma;

//-------------------------------------------------------------------------------
double Indyuk(int shift)
{
   return (iCustom(0,0,Indicator,param1,param2,/*param3, è ò.ä.:)*/mode,shift));
}

double MathTanh(double x)
{
   double exp;
   if(x>0)  {exp=MathExp(-2*x);return ((1-exp)/(1+exp));}
   else {exp=MathExp(2*x);return ((exp-1)/(1+exp));}
}

double ArrayAverage(double a[])
{
   int i;
   double s;
   if(ArraySize(a)<1) return (0);
   s=0;
   for(i=0;i<ArraySize(a);i++)  s+=a[i];
   return (s/ArraySize(a));
}

//+------------------------------------------------------------------+
//| Custom indicator initialization function                         |
//+------------------------------------------------------------------+
int init()
  {
//---- indicators
   IndicatorShortName("Normalized "+Indicator);
   SetIndexStyle(0,DRAW_LINE);
   SetIndexBuffer(0,Normalizer);

   int i;
   int count, count_zeros;
   count=0;
   count_zeros=0;
   double periods[];
   for(i=Bars-2;i>=0;i--)
   {
      if(Indyuk(i)*Indyuk(i+1)<0)//ïåðåõîä ÷åðåç 0
         {
            count++;
            ArrayResize(periods,count);
            periods[ArraySize(periods)-1]=0;
         }
      if(ArraySize(periods)>0) periods[ArraySize(periods)-1]++;
   }

   characteristic_period=2*PERIODS_CHARACTERISTIC*ArrayAverage(periods);

   SetIndexDrawBegin(0,characteristic_period);
//----
   return(0);
  }
//+------------------------------------------------------------------+
//| Custom indicator deinitialization function                       |
//+------------------------------------------------------------------+
int deinit()
  {
//----

//----
   return(0);
  }
//+------------------------------------------------------------------+
//| Custom indicator iteration function                              |
//+------------------------------------------------------------------+
int start()
  {
   int   i,j, counted_bars=IndicatorCounted();
   double S;
//----
   for(i=Bars-counted_bars-characteristic_period-1;i>=0;i--)
   {
      S=0;
      for(j=0;j<characteristic_period;j++) S+=MathPow(Indyuk(i+j),2);
      S/=characteristic_period;
      S=MathSqrt(S);
      if(S!=0) Normalizer[i]=Indyuk(i)/S;
      Normalizer[i]=MathTanh(Normalizer[i]);
   }
//----
   return(0);
  }
//+------------------------------------------------------------------+
Comments