EJ_Signal_001
Download script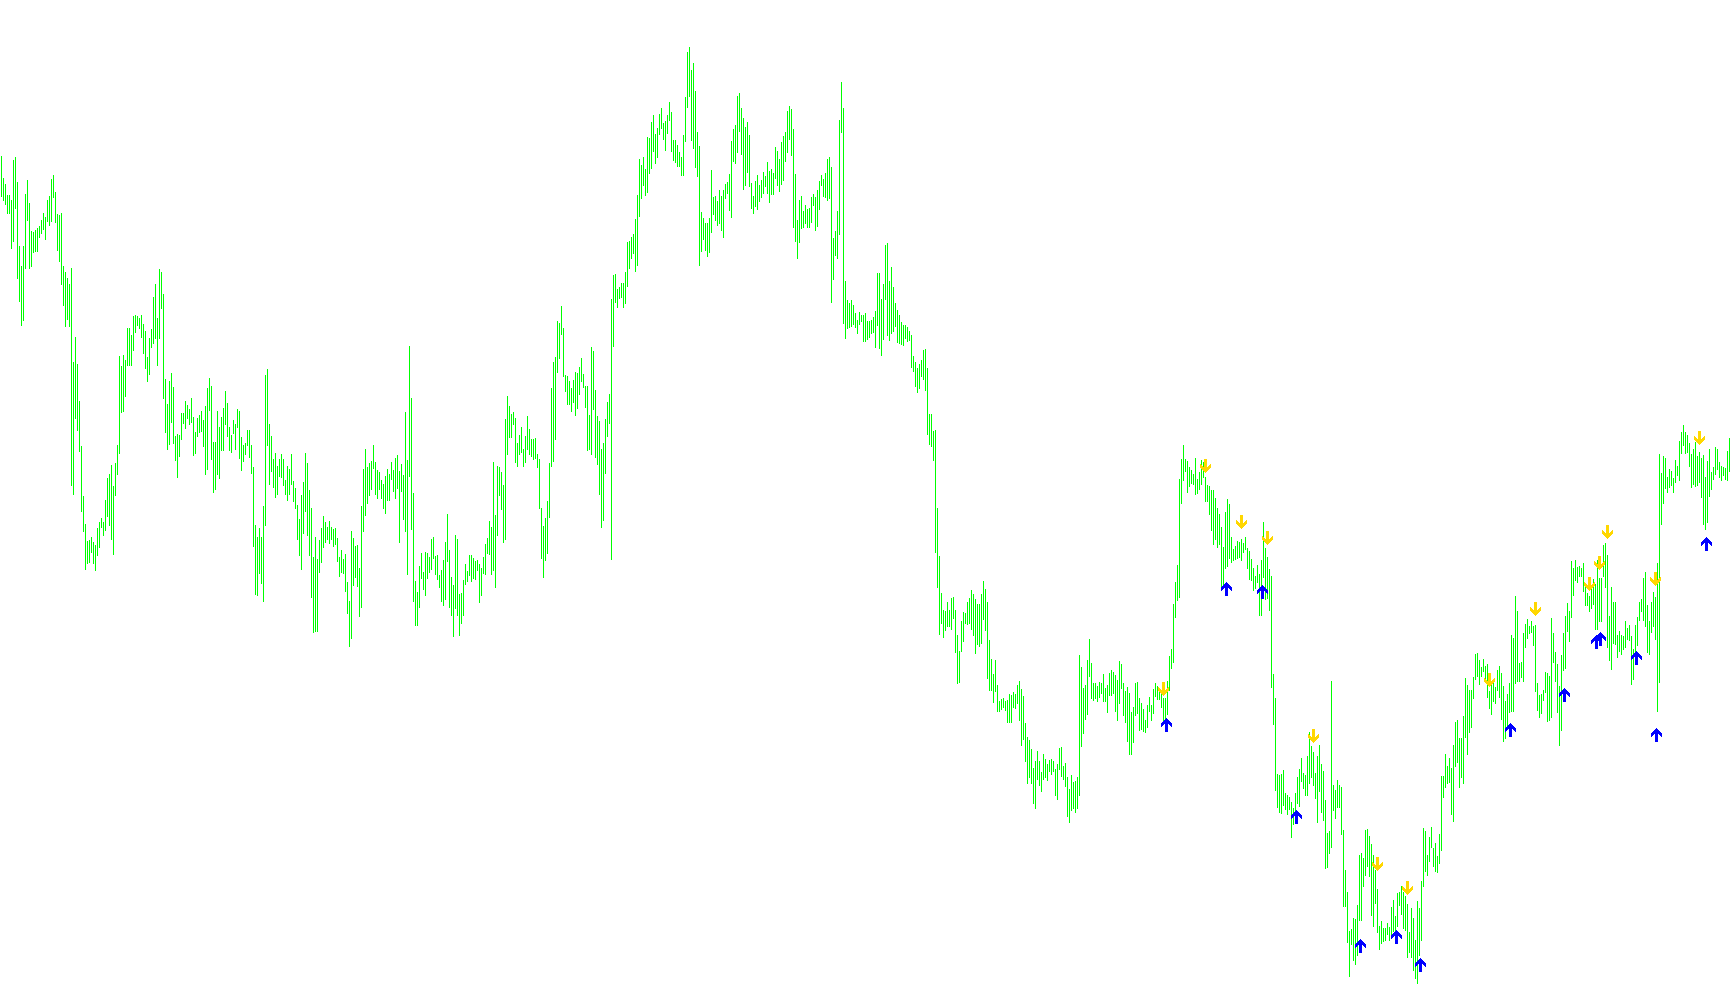
This script is a technical analysis tool designed for the MetaTrader platform to identify specific price action trends and potential reversal points. Rather than simply following standard indicators like Moving Averages, it uses a custom logic sequence to evaluate market volatility and momentum.
Core Logic Overview
The script operates by analyzing historical price data (Highs, Lows, Opens, and Closes) over a rolling window of bars to determine the "health" of the current trend. It achieves this through three primary stages:
1. Volatility and Range Analysis The script first calculates the average price range over a specific period. It looks for significant gaps or movements in price—specifically, it identifies moments where the price has jumped significantly larger than the average expected movement. This helps the tool distinguish between "noisy" sideways markets and genuine impulsive moves.
2. Momentum Calculation (MRO) The indicator utilizes a specialized calculation based on the Williams Percent Range (WPR), but with a twist. It dynamically adjusts the "look-back" period of this calculation based on the market's behavior:
- If the script detects a significant price jump, it shortens the window to react more quickly to the new momentum.
- If no such jump is detected, it maintains a longer, more stable window to filter out minor fluctuations.
3. Trend Signal Identification The final logic determines when to display a signal (an arrow on the chart). It looks for specific "breakout" conditions:
- Downside Signals: If the momentum value drops below a certain threshold and then recovers past a specific upper limit, it signals a potential reversal or entry point.
- Upside Signals: Conversely, if the momentum value rises above a specific threshold and then retreats past a lower limit, it signals an opposite movement.
User Parameters
The tool allows for two main adjustments to customize its sensitivity:
- Risk: This adjusts the "buffer" zones used to calculate the signal thresholds. Increasing this value makes the script more conservative (requiring stronger movements to trigger a signal), while decreasing it makes it more aggressive.
- CountBars: This defines how much historical data the script processes at one time.
Visual Output
When the logic confirms a trend change based on the calculations above, the script places visual arrows on the chart (Magenta and Aqua colors). These serve as markers to highlight where the mathematical conditions for a trend shift have been met.
//+------------------------------------------------------------------+
//| ASCTrend1sig_noSound.mq4
//| Ramdass - Conversion only
//+------------------------------------------------------------------+

#property indicator_chart_window
#property indicator_buffers 2
#property indicator_color1 Magenta
#property indicator_color2 Aqua

//---- input parameters
extern int RISK=3;
extern int CountBars=300;

//---- buffers
double val1[];
double val2[];


//+------------------------------------------------------------------+
//| Custom indicator initialization function                         |
//+------------------------------------------------------------------+
int init()
  {
//---- indicator line
   IndicatorBuffers(2);
   SetIndexStyle(0,DRAW_ARROW);
   SetIndexArrow(0,234);
   SetIndexStyle(1,DRAW_ARROW);
   SetIndexArrow(1,233);
   SetIndexBuffer(0,val1);
   SetIndexBuffer(1,val2);

//----
   return(0);
  }
//+------------------------------------------------------------------+
//| ASCTrend1sig                                                     |
//+------------------------------------------------------------------+
int start()
  {
   if (CountBars>=1000) CountBars=950;
   SetIndexDrawBegin(0,Bars-CountBars+11+1);
   SetIndexDrawBegin(1,Bars-CountBars+11+1);
   int i,shift,counted_bars=IndicatorCounted();
   int Counter,i1,value10,value11;
   double value1,x1,x2;
   double value2,value3;
   double TrueCount,Range,AvgRange,MRO1,MRO2;
   double Table_value2[1000];

   value10=3+RISK*2;
   x1=67+RISK;
   x2=33-RISK;
   value11=value10;
//----
   if(Bars<=11+1) return(0);
//---- initial zero
   if(counted_bars<11+1)
   {
      for(i=1;i<=0;i++) val1[CountBars-i]=0.0;
      for(i=1;i<=0;i++) val2[CountBars-i]=0.0;
   }
//----
   shift=CountBars-11-1;
   while(shift>=0)
     {

   Counter=shift;
	Range=0.0;
	AvgRange=0.0;
	for (Counter=shift; Counter<=shift+9; Counter++) AvgRange=AvgRange+MathAbs(High[Counter]-Low[Counter]);

	Range=AvgRange/10;
	Counter=shift;
	TrueCount=0;
	while (Counter<shift+9 && TrueCount<1)
		{if (MathAbs(Open[Counter]-Close[Counter+1])>=Range*2.0) TrueCount=TrueCount+1;
		Counter=Counter+1;
		}
	if (TrueCount>=1) {MRO1=Counter;} else {MRO1=-1;}
	Counter=shift;
	TrueCount=0;
	while (Counter<shift+6 && TrueCount<1)
		{if (MathAbs(Close[Counter+3]-Close[Counter])>=Range*4.6) TrueCount=TrueCount+1;
		Counter=Counter+1;
		}
	if (TrueCount>=1) {MRO2=Counter;} else {MRO2=-1;}
	if (MRO1>-1) {value11=3;} else {value11=value10;}
	if (MRO2>-1) {value11=4;} else {value11=value10;}
	value2=100-MathAbs(iWPR(NULL,0,value11,shift)); // PercentR(value11=9)
	Table_value2[shift]=value2;
	val1[shift]=0;
	val2[shift]=0;
	value3=0;
	if (value2<x2)
		{i1=1;
		while (Table_value2[shift+i1]>=x2 && Table_value2[shift+i1]<=x1){i1++;}
		if (Table_value2[shift+i1]>x1)
			{
			value3=High[shift]+Range*0.5;
			val1[shift]=value3;
			}
		}
	if (value2>x1)
		{i1=1;
		while (Table_value2[shift+i1]>=x2 && Table_value2[shift+i1]<=x1){i1++;}
		if (Table_value2[shift+i1]<x2)
			{
			value3=Low[shift]-Range*0.5;
			val2[shift]=value3;
			}
		}

      shift--;
     }

   return(0);
  }
//+------------------------------------------------------------------+
Comments