StepMA_Stoch_v1_v2
Download script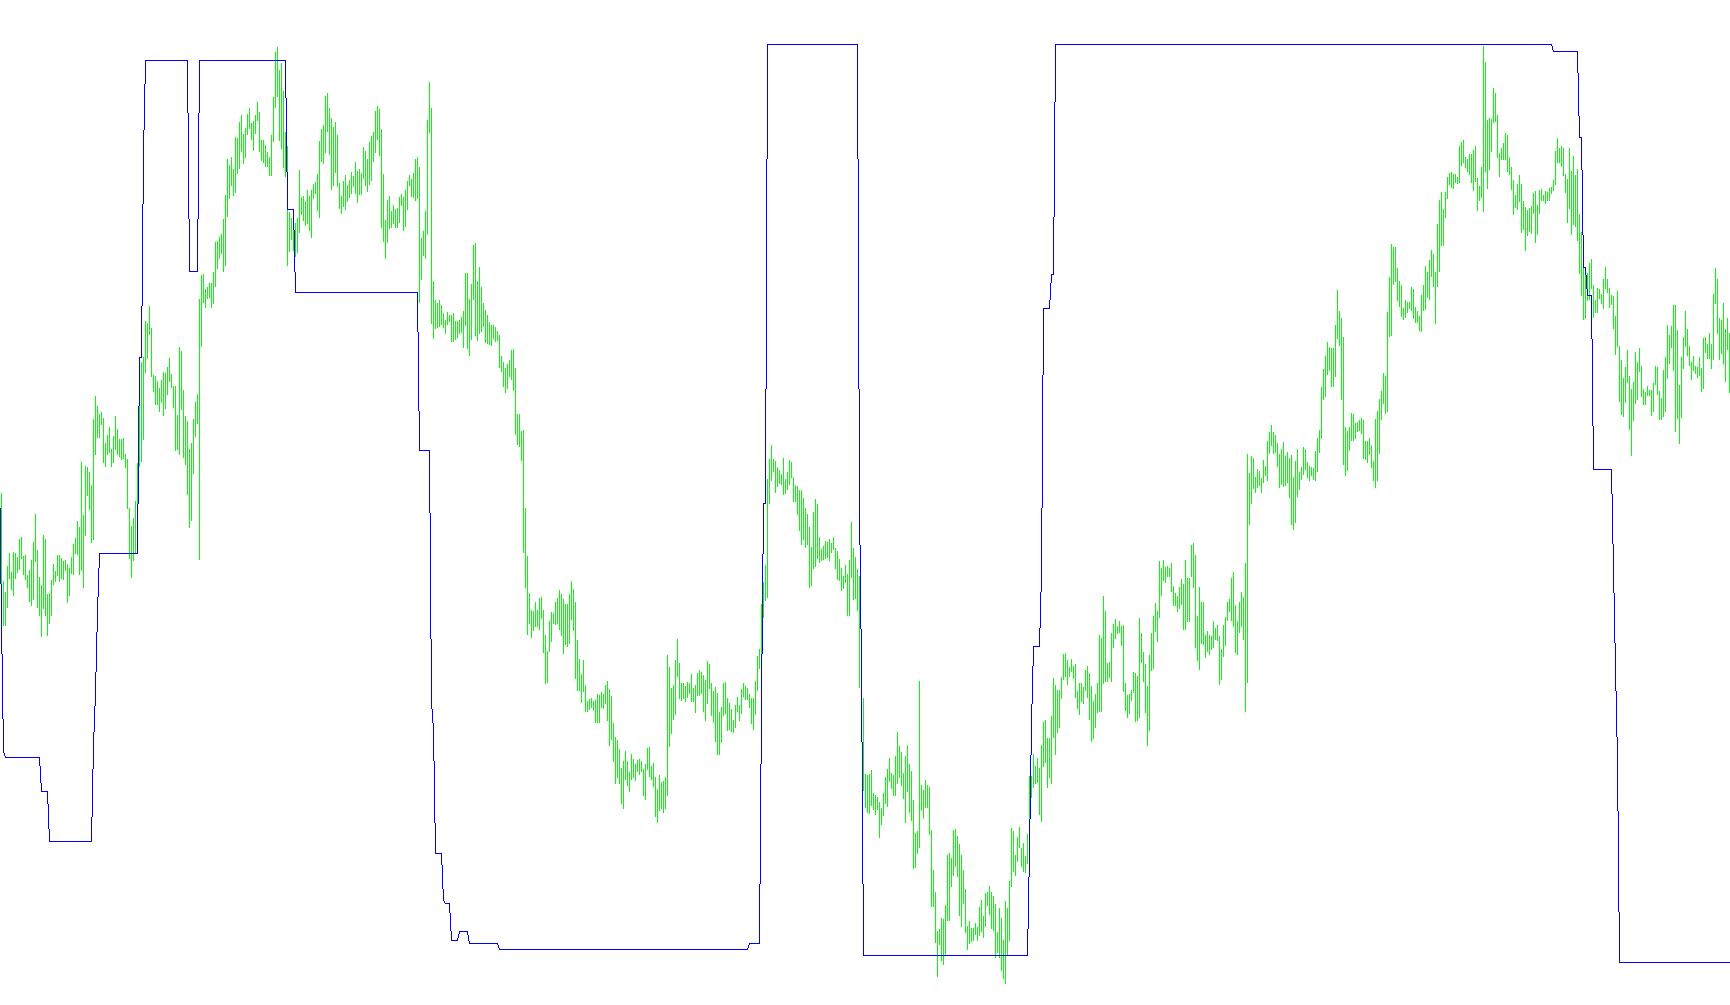
This script is a technical analysis tool designed to visualize market trends and momentum by calculating "Step Moving Averages" integrated with a Stochastic-style output. Instead of showing standard price averages, it identifies the underlying volatility and directional "steps" of the market to provide a smoother look at price behavior.
Core Logic Overview
The indicator operates through three primary phases: Volatility Measurement, Trend Identification, and Stochastic Mapping.
1. Volatility Calculation (WATR)
The script begins by analyzing a specific window of historical data (defined by the user). It calculates the range between the highest and lowest prices over this period. This is used to determine the "volatility environment." By establishing the maximum and minimum volatility levels, the tool creates dynamic boundaries that adjust automatically as market conditions change from calm to turbulent.
2. Dynamic Step Boundaries
Once the volatility is established, the script calculates three distinct "Step Sizes" based on the user's multiplier settings:
- Minimum: Reflects low-volatility movements.
- Maximum: Reflects high-volatility movements.
- Mid: Represents the average movement between the two.
The tool uses these sizes to create invisible "zones" around the current price. It checks whether the price is closing above or below these specific zones to determine the current market trend. This allows the script to distinguish between a strong breakout (pushing past high-volatility boundaries) and a minor fluctuation.
3. Trend Persistence and Smoothing
To prevent the indicator from reacting too erratically to "noise," the script includes a persistence logic. If the market is in an established uptrend, the tool ignores minor dips that don't break out of the designated safety zone. Conversely, in a downtrend, it ignores small rallies. This ensures that the resulting lines reflect sustained momentum rather than momentary price spikes.
4. Stochastic Visualization
The final stage converts these complex trend calculations into a normalized visual format (similar to a Stochastic Oscillator). The script takes the calculated "Step" values and maps them onto a scale of 0 to 1.
What this means for the user: Instead of seeing raw price points, you see two lines that represent different momentum intensities. These lines smooth out the market's "steps," helping traders identify:
- The strength of the current trend.
- Whether the price is moving at a high-volatility pace or a low-volatility pace.
- Potential exhaustion points where the momentum may be shifting.
//+------------------------------------------------------------------+
//|                                              StepMA_Stoch_v1.mq4 |
//|                           Copyright © 2005, TrendLaboratory Ltd. |
//|                                       E-mail: igorad2004@list.ru |
//+------------------------------------------------------------------+
#property copyright "Copyright © 2005, TrendLaboratory Ltd."
#property link      "E-mail: igorad2004@list.ru"

#property indicator_separate_window
#property indicator_buffers 2
#property indicator_color1 Yellow
#property indicator_color2 DeepSkyBlue
#property indicator_minimum 0
#property indicator_maximum 1
//---- input parameters
extern int PeriodWATR=10;
extern double Kwatr=1.0000;
extern int HighLow=0;
//---- indicator buffers
double LineMinBuffer[];
double LineMidBuffer[];
//+------------------------------------------------------------------+
//| Custom indicator initialization function                         |
//+------------------------------------------------------------------+
  int init()
  {
   string short_name;
//---- indicator line
   SetIndexStyle(0,DRAW_NONE);
   SetIndexStyle(1,DRAW_LINE,STYLE_SOLID,1);
   SetIndexBuffer(0,LineMinBuffer);
   SetIndexBuffer(1,LineMidBuffer);
   IndicatorDigits(MarketInfo(Symbol(),MODE_DIGITS));
//---- name for DataWindow and indicator subwindow label
   short_name="StepMA Stoch("+PeriodWATR+","+Kwatr+","+HighLow+")";
   IndicatorShortName(short_name);
   SetIndexLabel(0,"StepMA Stoch 1");
   SetIndexLabel(1,"StepMA Stoch 2");
//----
   SetIndexDrawBegin(0,PeriodWATR);
   SetIndexDrawBegin(1,PeriodWATR);
//----
   return(0);
  }

//+------------------------------------------------------------------+
//| StepMA_3D_v1                                                         |
//+------------------------------------------------------------------+
int start()
  {
   int      i,shift,TrendMin,TrendMax,TrendMid;
   double   SminMin0,SmaxMin0,SminMin1,SmaxMin1,SumRange,dK,WATR0,WATRmax,WATRmin,WATRmid;
   double   SminMax0,SmaxMax0,SminMax1,SmaxMax1,SminMid0,SmaxMid0,SminMid1,SmaxMid1;
   double   linemin,linemax,linemid,Stoch1,Stoch2,bsmin,bsmax;

   for(shift=Bars-1;shift>=0;shift--)
   {
	SumRange=0;
	for (i=PeriodWATR-1;i>=0;i--)
	    {
       dK = 1+1.0*(PeriodWATR-i)/PeriodWATR;
       SumRange+= dK*MathAbs(High[i+shift]-Low[i+shift]);
       }
	WATR0 = SumRange/PeriodWATR;

	WATRmax=MathMax(WATR0,WATRmax);
	if (shift==Bars-1-PeriodWATR) WATRmin=WATR0;
	WATRmin=MathMin(WATR0,WATRmin);

	int StepSizeMin=MathRound(Kwatr*WATRmin/Point);
	int StepSizeMax=MathRound(Kwatr*WATRmax/Point);
	int StepSizeMid=MathRound(Kwatr*0.5*(WATRmax+WATRmin)/Point);

	if (HighLow>0)
	  {
	  SmaxMin0=Low[shift]+2*StepSizeMin*Point;
	  SminMin0=High[shift]-2*StepSizeMin*Point;

	  SmaxMax0=Low[shift]+2*StepSizeMax*Point;
	  SminMax0=High[shift]-2*StepSizeMax*Point;

	  SmaxMid0=Low[shift]+2*StepSizeMid*Point;
	  SminMid0=High[shift]-2*StepSizeMid*Point;

	  if(Close[shift]>SmaxMin1) TrendMin=1;
	  if(Close[shift]<SminMin1) TrendMin=-1;

	  if(Close[shift]>SmaxMax1) TrendMax=1;
	  if(Close[shift]<SminMax1) TrendMax=-1;

	  if(Close[shift]>SmaxMid1) TrendMid=1;
	  if(Close[shift]<SminMid1) TrendMid=-1;
	  }

	if (HighLow == 0)
	  {
	  SmaxMin0=Close[shift]+2*StepSizeMin*Point;
	  SminMin0=Close[shift]-2*StepSizeMin*Point;

	  SmaxMax0=Close[shift]+2*StepSizeMax*Point;
	  SminMax0=Close[shift]-2*StepSizeMax*Point;

	  SmaxMid0=Close[shift]+2*StepSizeMid*Point;
	  SminMid0=Close[shift]-2*StepSizeMid*Point;

	  if(Close[shift]>SmaxMin1) TrendMin=1;
	  if(Close[shift]<SminMin1) TrendMin=-1;

	  if(Close[shift]>SmaxMax1) TrendMax=1;
	  if(Close[shift]<SminMax1) TrendMax=-1;

	  if(Close[shift]>SmaxMid1) TrendMid=1;
	  if(Close[shift]<SminMid1) TrendMid=-1;
	  }

	  if(TrendMin>0 && SminMin0<SminMin1) SminMin0=SminMin1;
	  if(TrendMin<0 && SmaxMin0>SmaxMin1) SmaxMin0=SmaxMin1;

	  if(TrendMax>0 && SminMax0<SminMax1) SminMax0=SminMax1;
	  if(TrendMax<0 && SmaxMax0>SmaxMax1) SmaxMax0=SmaxMax1;

	  if(TrendMid>0 && SminMid0<SminMid1) SminMid0=SminMid1;
	  if(TrendMid<0 && SmaxMid0>SmaxMid1) SmaxMid0=SmaxMid1;


	  if (TrendMin>0) linemin=SminMin0+StepSizeMin*Point;
	  if (TrendMin<0) linemin=SmaxMin0-StepSizeMin*Point;

	  if (TrendMax>0) linemax=SminMax0+StepSizeMax*Point;
	  if (TrendMax<0) linemax=SmaxMax0-StepSizeMax*Point;

	  if (TrendMid>0) linemid=SminMid0+StepSizeMid*Point;
	  if (TrendMid<0) linemid=SmaxMid0-StepSizeMid*Point;

	  bsmin=linemax-StepSizeMax*Point;
	  bsmax=linemax+StepSizeMax*Point;
	  Stoch1=(linemin-bsmin)/(bsmax-bsmin);
	  Stoch2=(linemid-bsmin)/(bsmax-bsmin);

	  LineMinBuffer[shift]=Stoch1;
	  LineMidBuffer[shift]=Stoch2;


	  SminMin1=SminMin0;
	  SmaxMin1=SmaxMin0;

	  SminMax1=SminMax0;
	  SmaxMax1=SmaxMax0;

	  SminMid1=SminMid0;
	  SmaxMid1=SmaxMid0;
	 }
	return(0);
 }
Comments