StepMA_Stoch_v1
Download script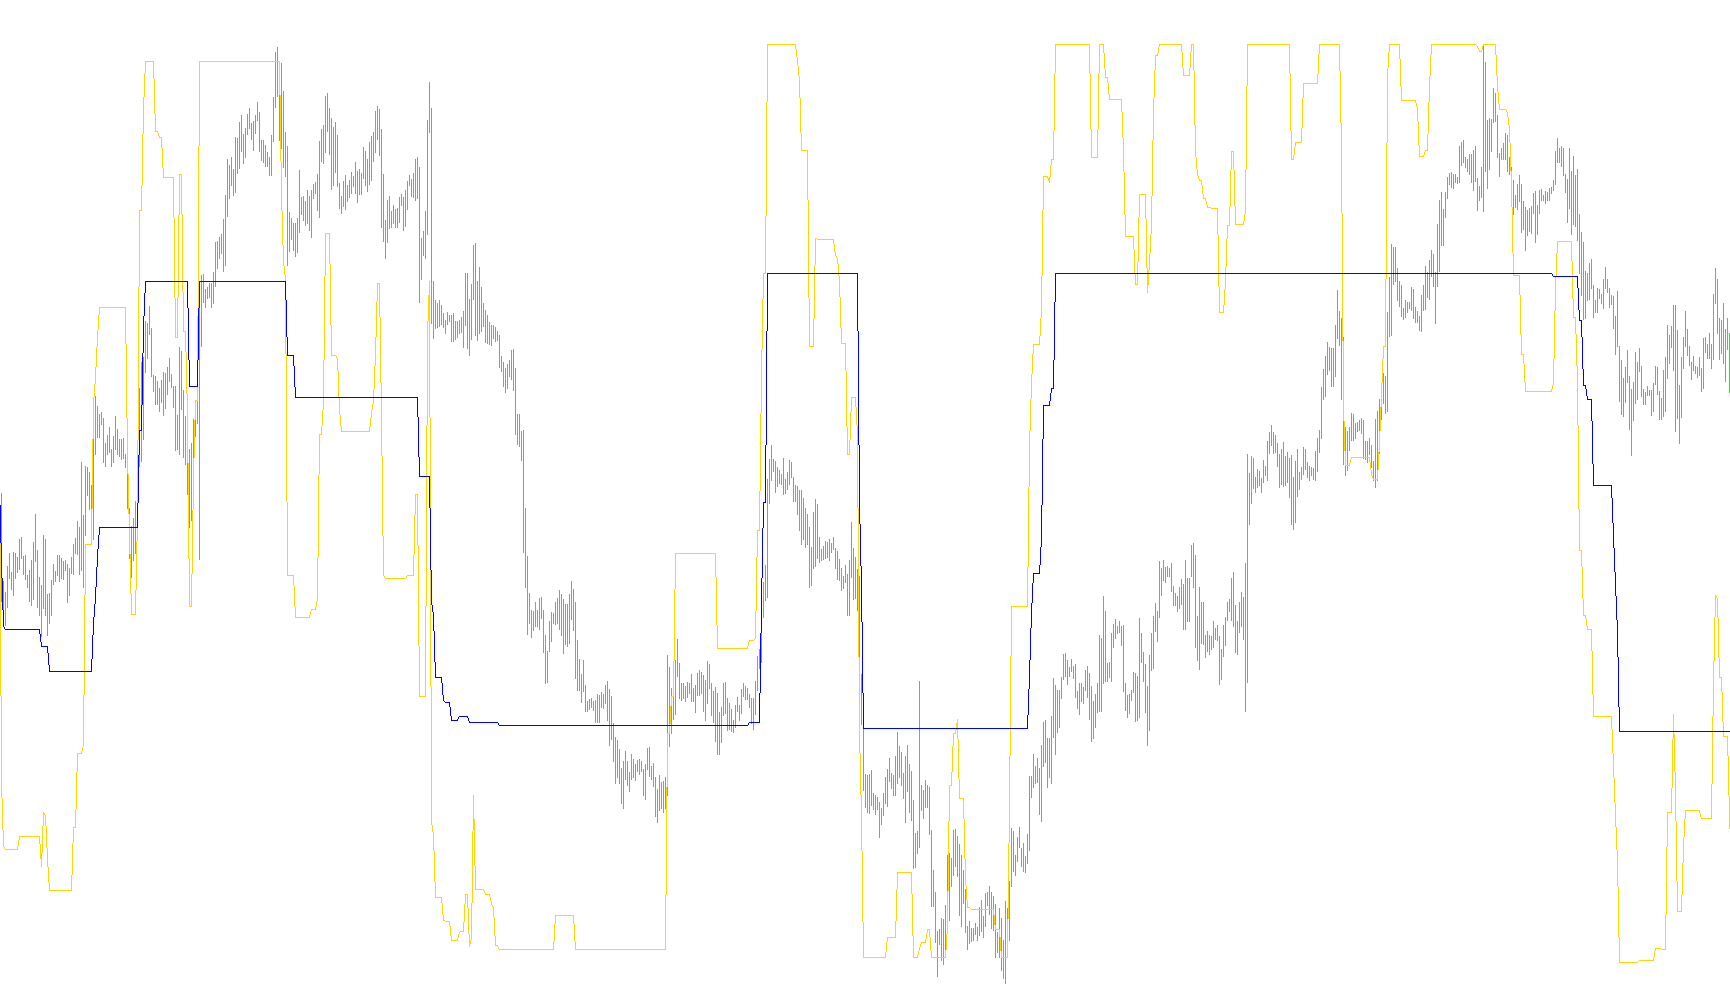
This script functions as a sophisticated technical analysis tool designed to track market trends and momentum by measuring price movement against "steps" of volatility. Instead of simply following the raw price, it calculates the market's dynamic range to determine whether the current trend is accelerating, stabilizing, or reversing.
Core Logic Overview
The indicator operates through three primary stages of calculation:
1. Volatility Measurement (Range Analysis) The script first analyzes a specific window of recent price history to calculate the average volatility. It doesn't just look at the distance between the highest and lowest prices; it applies a weighted calculation where more recent price action carries more significance. This results in a "Volatility Range" that adapts to the current market conditions—expanding when the market is active and contracting during quiet periods.
2. Dynamic Step Calculation Based on the volatility range identified above, the script establishes three distinct "Step Sizes":
- Minimum Step: Based on the lowest volatility observed.
- Maximum Step: Based on the highest volatility observed.
- Mid Step: The average of the minimum and maximum values.
These steps act as invisible thresholds. By defining these boundaries, the script creates a framework to identify how much "room" the price has to move before it is considered a significant trend change.
3. Trend Identification and Smoothing The script compares the current market price against these three different step levels to determine the active trend. It looks at whether the price has broken above or below the thresholds established by the Minimum, Maximum, and Mid steps:
- It identifies the direction of the movement (Up or Down).
- It applies "memory" logic: if a trend is moving upward, it ensures that the new boundary doesn't drop lower than the previous one; if it is moving downward, it ensures the boundary doesn't rise higher than the previous one. This prevents the indicator from becoming "jittery" due to minor price fluctuations.
4. Momentum Output (Stochastic Conversion) Finally, the script converts these trend boundaries into two distinct visual lines plotted in a separate window:
- The Minimum Line: Derived from the smallest volatility steps.
- The Mid Line: Derived from the average volatility steps.
By normalizing these values into a scale (typically between 0 and 1), the script allows traders to visualize momentum. When these lines move toward the top of the window, it suggests strong upward momentum; when they move toward the bottom, it suggests downward momentum. The distance between these lines can also provide insight into the "strength" or "compression" of the current market trend.
//+------------------------------------------------------------------+
//|                                              StepMA_Stoch_v1.mq4 |
//|                           Copyright © 2005, TrendLaboratory Ltd. |
//|                                       E-mail: igorad2004@list.ru |
//+------------------------------------------------------------------+
#property copyright "Copyright © 2005, TrendLaboratory Ltd."
#property link      "E-mail: igorad2004@list.ru"

#property indicator_separate_window
#property indicator_buffers 2
#property indicator_color1 Yellow
#property indicator_color2 DeepSkyBlue
#property indicator_minimum 0
#property indicator_maximum 1
//---- input parameters
extern int PeriodWATR=10;
extern double Kwatr=1.0000;
extern int HighLow=0;
//---- indicator buffers
double LineMinBuffer[];
double LineMidBuffer[];
//+------------------------------------------------------------------+
//| Custom indicator initialization function                         |
//+------------------------------------------------------------------+
  int init()
  {
   string short_name;
//---- indicator line
   SetIndexStyle(0,DRAW_LINE,STYLE_SOLID,1);
   SetIndexStyle(1,DRAW_LINE,STYLE_SOLID,1);
   SetIndexBuffer(0,LineMinBuffer);
   SetIndexBuffer(1,LineMidBuffer);
   IndicatorDigits(MarketInfo(Symbol(),MODE_DIGITS));
//---- name for DataWindow and indicator subwindow label
   short_name="StepMA Stoch("+PeriodWATR+","+Kwatr+","+HighLow+")";
   IndicatorShortName(short_name);
   SetIndexLabel(0,"StepMA Stoch 1");
   SetIndexLabel(1,"StepMA Stoch 2");
//----
   SetIndexDrawBegin(0,PeriodWATR);
   SetIndexDrawBegin(1,PeriodWATR);
//----
   return(0);
  }

//+------------------------------------------------------------------+
//| StepMA_3D_v1                                                         |
//+------------------------------------------------------------------+
int start()
  {
   int      i,shift,TrendMin,TrendMax,TrendMid;
   double   SminMin0,SmaxMin0,SminMin1,SmaxMin1,SumRange,dK,WATR0,WATRmax,WATRmin,WATRmid;
   double   SminMax0,SmaxMax0,SminMax1,SmaxMax1,SminMid0,SmaxMid0,SminMid1,SmaxMid1;
   double   linemin,linemax,linemid,Stoch1,Stoch2,bsmin,bsmax;

   for(shift=Bars-1;shift>=0;shift--)
   {
	SumRange=0;
	for (i=PeriodWATR-1;i>=0;i--)
	    {
       dK = 1+1.0*(PeriodWATR-i)/PeriodWATR;
       SumRange+= dK*MathAbs(High[i+shift]-Low[i+shift]);
       }
	WATR0 = SumRange/PeriodWATR;

	WATRmax=MathMax(WATR0,WATRmax);
	if (shift==Bars-1-PeriodWATR) WATRmin=WATR0;
	WATRmin=MathMin(WATR0,WATRmin);

	int StepSizeMin=MathRound(Kwatr*WATRmin/Point);
	int StepSizeMax=MathRound(Kwatr*WATRmax/Point);
	int StepSizeMid=MathRound(Kwatr*0.5*(WATRmax+WATRmin)/Point);

	if (HighLow>0)
	  {
	  SmaxMin0=Low[shift]+2*StepSizeMin*Point;
	  SminMin0=High[shift]-2*StepSizeMin*Point;

	  SmaxMax0=Low[shift]+2*StepSizeMax*Point;
	  SminMax0=High[shift]-2*StepSizeMax*Point;

	  SmaxMid0=Low[shift]+2*StepSizeMid*Point;
	  SminMid0=High[shift]-2*StepSizeMid*Point;

	  if(Close[shift]>SmaxMin1) TrendMin=1;
	  if(Close[shift]<SminMin1) TrendMin=-1;

	  if(Close[shift]>SmaxMax1) TrendMax=1;
	  if(Close[shift]<SminMax1) TrendMax=-1;

	  if(Close[shift]>SmaxMid1) TrendMid=1;
	  if(Close[shift]<SminMid1) TrendMid=-1;
	  }

	if (HighLow == 0)
	  {
	  SmaxMin0=Close[shift]+2*StepSizeMin*Point;
	  SminMin0=Close[shift]-2*StepSizeMin*Point;

	  SmaxMax0=Close[shift]+2*StepSizeMax*Point;
	  SminMax0=Close[shift]-2*StepSizeMax*Point;

	  SmaxMid0=Close[shift]+2*StepSizeMid*Point;
	  SminMid0=Close[shift]-2*StepSizeMid*Point;

	  if(Close[shift]>SmaxMin1) TrendMin=1;
	  if(Close[shift]<SminMin1) TrendMin=-1;

	  if(Close[shift]>SmaxMax1) TrendMax=1;
	  if(Close[shift]<SminMax1) TrendMax=-1;

	  if(Close[shift]>SmaxMid1) TrendMid=1;
	  if(Close[shift]<SminMid1) TrendMid=-1;
	  }

	  if(TrendMin>0 && SminMin0<SminMin1) SminMin0=SminMin1;
	  if(TrendMin<0 && SmaxMin0>SmaxMin1) SmaxMin0=SmaxMin1;

	  if(TrendMax>0 && SminMax0<SminMax1) SminMax0=SminMax1;
	  if(TrendMax<0 && SmaxMax0>SmaxMax1) SmaxMax0=SmaxMax1;

	  if(TrendMid>0 && SminMid0<SminMid1) SminMid0=SminMid1;
	  if(TrendMid<0 && SmaxMid0>SmaxMid1) SmaxMid0=SmaxMid1;


	  if (TrendMin>0) linemin=SminMin0+StepSizeMin*Point;
	  if (TrendMin<0) linemin=SmaxMin0-StepSizeMin*Point;

	  if (TrendMax>0) linemax=SminMax0+StepSizeMax*Point;
	  if (TrendMax<0) linemax=SmaxMax0-StepSizeMax*Point;

	  if (TrendMid>0) linemid=SminMid0+StepSizeMid*Point;
	  if (TrendMid<0) linemid=SmaxMid0-StepSizeMid*Point;

	  bsmin=linemax-StepSizeMax*Point;
	  bsmax=linemax+StepSizeMax*Point;
	  Stoch1=(linemin-bsmin)/(bsmax-bsmin);
	  Stoch2=(linemid-bsmin)/(bsmax-bsmin);

	  LineMinBuffer[shift]=Stoch1;
	  LineMidBuffer[shift]=Stoch2;


	  SminMin1=SminMin0;
	  SmaxMin1=SmaxMin0;

	  SminMax1=SminMax0;
	  SmaxMax1=SmaxMax0;

	  SminMid1=SminMid0;
	  SmaxMid1=SmaxMid0;
	 }
	return(0);
 }
Comments