StepMA_Stoch_NK_v1
Download script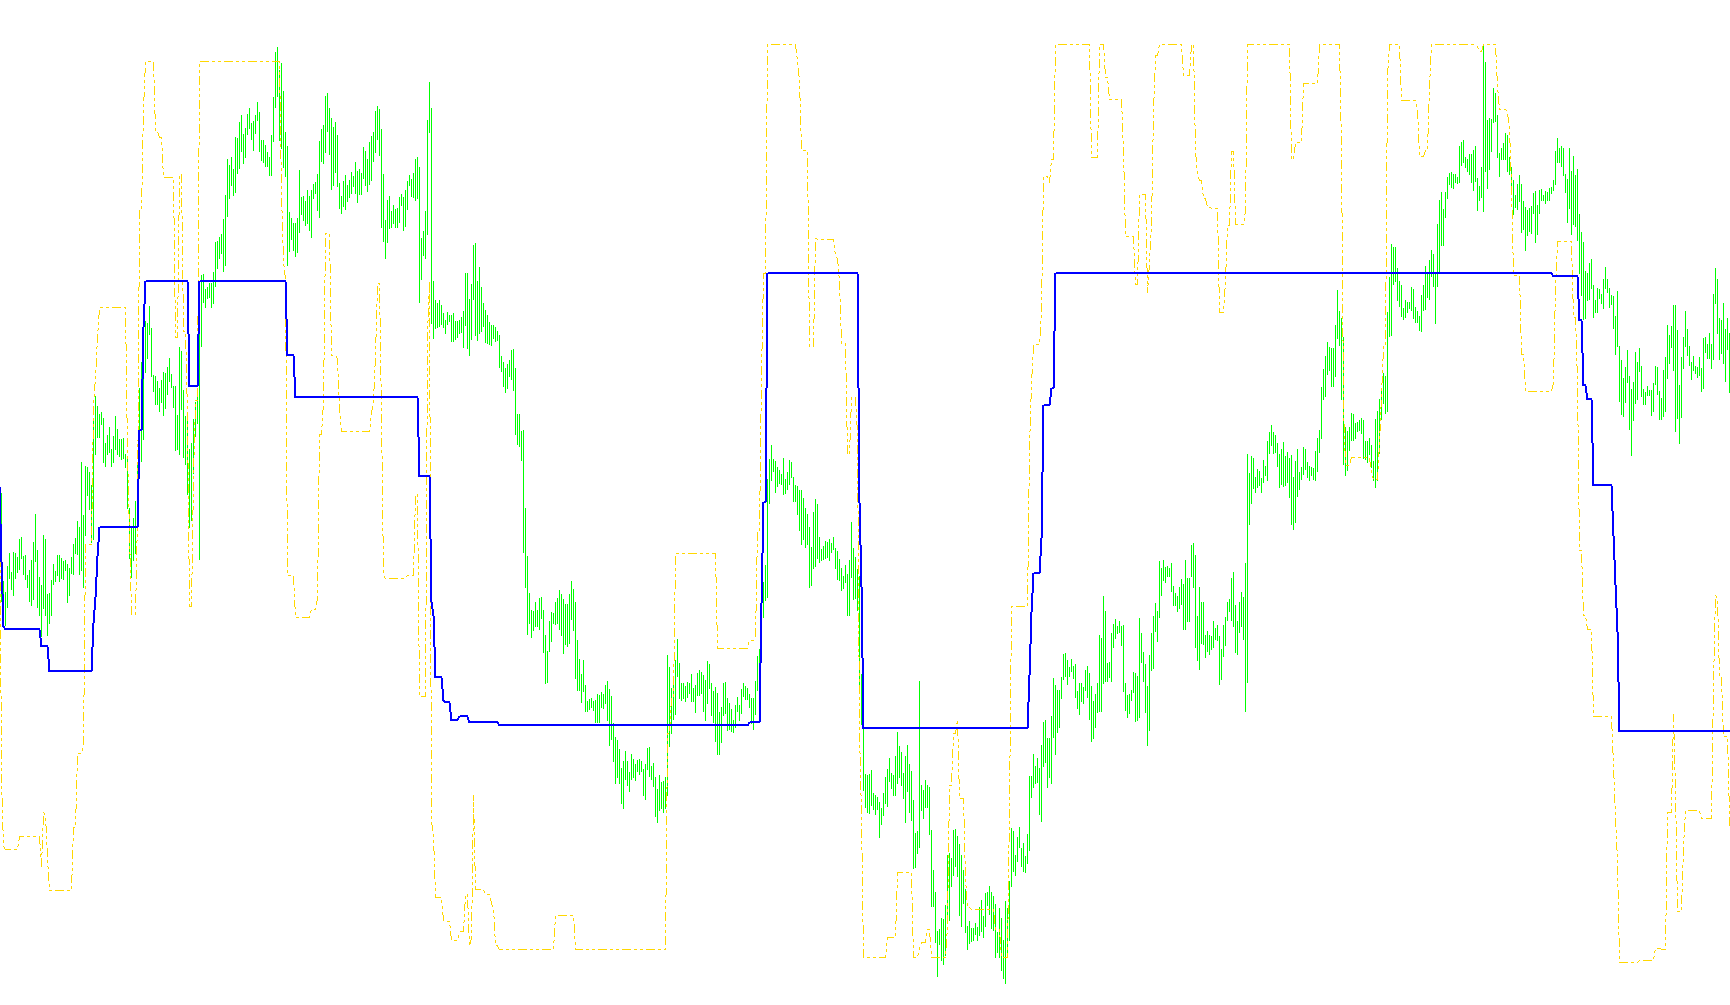
This script functions as a specialized technical indicator designed to analyze market trends by measuring price volatility and identifying "step-like" movements. Rather than simply following the price, it calculates the intensity of price swings to establish boundaries for trend detection.
Core Logic Overview
The indicator operates through three main phases: Volatility Measurement, Trend Identification, and Stochastic Mapping.
1. Volatility Measurement (WATR)
The script begins by calculating a weighted average of the price range (the difference between the High and Low prices) over a specific period. Unlike a standard average, this calculation applies more weight to recent price action. This helps the indicator understand the "normal" level of noise or volatility currently present in the market.
2. Dynamic Boundary Calculation
Based on the volatility measured above, the script establishes three distinct "zones" or steps:
- Minimum Step: Represents the smallest significant move.
- Maximum Step: Represents the largest significant move.
- Mid Step: Represents the average movement between the two.
These boundaries are not fixed; they expand or contract automatically based on how volatile the market is at that specific moment. If the market becomes highly active, these "steps" widen to account for the increased price swings.
3. Trend Detection and Filtering
The script constantly checks the current price against these dynamic boundaries. It classifies the market into three trend states:
- Trend Min: A detection of minor upward or downward momentum.
- Trend Max: A detection of strong, significant momentum.
- Trend Mid: A detection of moderate, steady movement.
The logic includes a "memory" feature where it ensures that as the trend progresses, the boundaries do not retreat in a way that would invalidate the current direction (essentially smoothing out the lines to prevent erratic jumping).
4. Stochastic Visualization
Finally, the script converts these complex boundary calculations into a simplified percentage-based output, similar to a standard Stochastic Oscillator. It maps the positions of the "Min," "Mid," and "Max" trends onto a scale of 0 to 1 (or 0% to 100%).
The result for the user: Instead of looking at raw price spikes, the indicator provides two smoothed lines in a separate window. These lines represent the relative strength of the current price movement compared to the historical volatility of the market, helping traders visualize whether the current trend is strong, moderate, or weak.
//+X----------------------------------------------------------------x+
// Edited Nikolay Kositsin  2008.05.20 E-mail: farria@mail.redcom.ru |
//+X----------------------------------------------------------------x+
//+X================================================================X+
//|                                              StepMA_Stoch_NK.mq4 |
//|                          Copyright © 2005,  TrendLaboratory Ltd. |
//|                                       E-mail: igorad2004@list.ru |
//+X================================================================X+
#property copyright "Copyright © 2005,  TrendLaboratory Ltd."
#property link "http://www.forex-instruments.info"
//---- îòðèñîâêà èíäèêàòîðà â îòäåëüíîì îêíå
#property indicator_separate_window
//---- êîëè÷åñòâî èíäèêàòîðíûõ áóôåðîâ
#property indicator_buffers 2
//---- öâåòà èíäèêàòîðà
#property indicator_color1 Gold
#property indicator_color2 BlueViolet
//---- îïðåäåëåíèå íèæíåãî è âåðõíåãî
            //çíà÷åíèÿ îòäåëüíîãî îêíà èíäèêàòîðà
#property indicator_minimum 0
#property indicator_maximum 1
//---- ÂÕÎÄÍÛÅ ÏÀÐÀÌÅÒÐÛ ÈÍÄÈÊÀÒÎÐÀ
extern int    PeriodWATR = 10;
extern double Kwatr = 1.0000;
extern int    HighLow = 0;
//---- èíäèêàòîðíûå áóôåðû
double LineMinBuffer[];
double LineMidBuffer[];
//+X================================================================X+
//| StepMA_Stoch_NK indicator initialization function                |
//+X================================================================X+
  int init()
  {
//---- óñòàíîâêà ñòèëÿ èçîáðàæåíèÿ èíäèêàòîðà
   SetIndexStyle(0, DRAW_LINE, STYLE_DASHDOTDOT, 1);
   SetIndexStyle(1, DRAW_LINE, STYLE_SOLID, 2);
//---- îïðåäåëåíèå áóôåðîâ äëÿ ïîäñ÷¸òà
   SetIndexBuffer(0, LineMinBuffer);
   SetIndexBuffer(1, LineMidBuffer);
//---- Óñòàíîâêà ôîðìàòà òî÷íîñòè (êîëè÷åñòâî çíàêîâ ïîñëå
          //äåñÿòè÷íîé òî÷êè) äëÿ âèçóàëèçàöèè çíà÷åíèé èíäèêàòîðà
   IndicatorDigits(Digits);
//---- name for DataWindow and indicator subwindow label
   string short_name="StepMA Stoch("
                  + PeriodWATR + ", " + Kwatr + ", " + HighLow + ")";
   IndicatorShortName(short_name);
   SetIndexLabel(0, "StepMA Stoch 1");
   SetIndexLabel(1, "StepMA Stoch 2");
//---- óñòàíîâêà íîìåðà áàðà,
                //íà÷èíàÿ ñ êîòîðîãî áóäåò îòðèñîâûâàòüñÿ èíäèêàòîð
   SetIndexDrawBegin(0, PeriodWATR);
   SetIndexDrawBegin(1, PeriodWATR);
//---- çàâåðøåíèå èíèöèàëèçàöèè
   return(0);
  }
//+X================================================================X+
//| StepMA_Stoch_NK                                                  |
//+X================================================================X+
int start()
  {
   //---- Ïðîâåðêà êîëè÷åñòâà áàðîâ íà äîñòàòî÷íîñòü
                                //äëÿ äàëüíåéøåãî ðàñ÷¸òà
   if (Bars - 1 < PeriodWATR)
                        return(0);
   //----
   static int      TrendMid_, time2;
   static int      TrendMin_, TrendMax_;
   //----
   static double   WATRmax_, WATRmin_;
   static double   SminMin1_, SmaxMin1_;
   static double   SminMax1_, SmaxMax1_;
   static double   SminMid1_, SmaxMid1_;
   //----
   int      counted_bars, Tnew;
   int      iii, bar, MaxBar, limit;
   int      TrendMin, TrendMax, TrendMid;
   int      StepSizeMin, StepSizeMax, StepSizeMid;
   //----
   double   close, high, low;
   double   WATRmax, WATRmin;
   double   SumRange, dK, WATR0;
   double   SizeMin, SizeMax, SizeMid, pKwatr;
   double   SizeMin2, SizeMax2, SizeMid2, point;
   double   SminMin0, SmaxMin0, SminMin1, SmaxMin1;
   double   SminMax0, SmaxMax0, SminMax1, SmaxMax1;
   double   SminMid0, SmaxMid0, SminMid1, SmaxMid1;
   double   Stoch1, Stoch2, bsmin, bsmax;
   double   linemin, linemax, linemid;
   //----Ïîëó÷åíèå óæå ïîñ÷èòàííûõ áàðîâ
   counted_bars = IndicatorCounted();
   //---- ïðîâåðêà íà âîçìîæíûå îøèáêè
   if (counted_bars < 0)
                 return(-1);
   //---- ïîñëåäíèé ïîñ÷èòàííûé áàð äîëæåí áûòü ïåðåñ÷èòàí
   if (counted_bars > 0)
                counted_bars--;
   //---- îïðåäåëåíèå íîìåðà ñàìîãî ñòàðîãî áàðà,
          // íà÷èíàÿ ñ êîòîðîãî áóäåò ïðîèçåä¸í ïåðåñ÷¸ò íîâûõ áàðîâ
   limit = Bars - counted_bars - 1;
   //---- îïðåäåëåíèå íîìåðà ñàìîãî ñòàðîãî áàðà,
          // íà÷èíàÿ ñ êîòîðîãî áóäåò ïðîèçåä¸í ïåðåñ÷¸ò âñåõ áàðîâ
   MaxBar = Bars - 1 - PeriodWATR;
   //----
   if (limit > MaxBar)
                limit = MaxBar;

   //+---+ âîññòàíîâëåíèå çíà÷åíèé ïåðåìåííûõ +------------------------+
   Tnew = Time[limit + 1];
   if (limit < MaxBar)
    if (Tnew == time2)
     {
      WATRmax = WATRmax_;
	   WATRmin = WATRmin_;
	   //----
      SminMin1 = SminMin1_;
	   SmaxMin1 = SmaxMin1_;
	   //----
	   SminMax1 = SminMax1_;
	   SmaxMax1 = SmaxMax1_;
	   //----
	   SminMid1 = SminMid1_;
	   SmaxMid1 = SmaxMid1_;
	   //----
	   TrendMin = TrendMin_;
	   TrendMax = TrendMax_;
	   TrendMid = TrendMid_;
     }
   else
     {
      if (Tnew>time2)
           Print("Îøèáêà âîññòàíîâëåíèÿ ïåðåìåííûõ!!! Tnew>time2");
      else Print("Îøèáêà âîññòàíîâëåíèÿ ïåðåìåííûõ!!! Tnew<time2");
      Print("Áóäåò ïðîèçâåä¸í ïåðåñ÷¸ò èíäèêàòîðà íà âñåõ áàðàõ!");
      return(-1);
     }
   //+---+ +-------------------------------------------------------------+

   for(bar = limit; bar >= 0; bar--)
   {
    //+---+ Ñîõðàíåíèå çíà÷åíèé ïåðåìåííûõ
     if (bar == 1)
       {
         WATRmax_ = WATRmax;
	      WATRmin_ = WATRmin;
	      //----
         SminMin1_ = SminMin1;
	      SmaxMin1_ = SmaxMin1;
	      //----
	      SminMax1_ = SminMax1;
	      SmaxMax1_ = SmaxMax1;
	      //----
	      SminMid1_ = SminMid1;
	      SmaxMid1_ = SmaxMid1;
	      //----
	      TrendMin_ = TrendMin;
	      TrendMax_ = TrendMax;
	      TrendMid_ = TrendMid;
	      //----
         time2 = Time[2];
       }
     //+---+
     //----
     SumRange = 0.0;
     //----
	  for (iii = PeriodWATR - 1; iii >= 0; iii--)
	    {
         dK = 1.0 + 1.0 * (PeriodWATR - iii) / PeriodWATR;
         SumRange += dK * MathAbs(High[bar + iii] - Low[bar + iii]);
       }
     //----
	  WATR0 = SumRange / PeriodWATR;
	  //----
	  WATRmax = MathMax(WATR0, WATRmax);
	  if (bar == MaxBar)
	             WATRmin = WATR0;
	  //----
	  WATRmin = MathMin(WATR0, WATRmin);
	  //----
	  point = Point;
	  //----
	  pKwatr = Kwatr / point;

	  StepSizeMin = MathRound(pKwatr * WATRmin);
	  StepSizeMax = MathRound(pKwatr * WATRmax);
     StepSizeMid = MathRound(pKwatr * 0.5 * (WATRmax + WATRmin));
     //----
     SizeMin = StepSizeMin * point;
     SizeMax = StepSizeMax * point;
     SizeMid = StepSizeMid * point;
     //----
     SizeMin2 = 2 * SizeMin;
     SizeMax2 = 2 * SizeMax;
     SizeMid2 = 2 * SizeMid;
     //----
     low = Low[bar];
     high = High[bar];
     close = Close[bar];
	  //----
	  if (HighLow > 0)
	   {
	    SmaxMin0 = low + SizeMin2;
	    SminMin0 = high - SizeMin2;
	    //----
	    SmaxMax0 = low + SizeMax2;
	    SminMax0 = high - SizeMax2;
	    //----
	    SmaxMid0 = low + SizeMid2;
	    SminMid0 = high - SizeMid2;
	    //----
	    if(close > SmaxMin1) TrendMin = 1;
	    if(close < SminMin1) TrendMin = -1;
	    //----
	    if(close > SmaxMax1) TrendMax = 1;
	    if(close < SminMax1) TrendMax = -1;
	    //----
	    if(close > SmaxMid1) TrendMid = 1;
	    if(close < SminMid1) TrendMid = -1;
	   }
	  //----
	  if (HighLow == 0)
	   {
	    SmaxMin0 = close + SizeMin2;
	    SminMin0 = close - SizeMin2;
	    //----
	    SmaxMax0 = close + SizeMax2;
	    SminMax0 = close - SizeMax2;
	    //----
	    SmaxMid0 = close + SizeMid2;
	    SminMid0 = close - SizeMid2;
	    //----
	    if(close > SmaxMin1)
	                    TrendMin = 1;
	    if(close < SminMin1)
	                    TrendMin = -1;
	    //----
	    if(close > SmaxMax1)
	                    TrendMax = 1;
	    if(close < SminMax1)
	                    TrendMax = -1;
	    //----
	    if(close > SmaxMid1)
	                    TrendMid = 1;
	    if(close < SminMid1)
	                    TrendMid = -1;
	   }
	  //----
	  if(TrendMin > 0 && SminMin0 < SminMin1)
	                               SminMin0 = SminMin1;
	  if(TrendMin < 0 && SmaxMin0 > SmaxMin1)
	                               SmaxMin0 = SmaxMin1;

	  if(TrendMax > 0 && SminMax0 < SminMax1)
	                               SminMax0 = SminMax1;
	  if(TrendMax < 0 && SmaxMax0 > SmaxMax1)
	                               SmaxMax0 = SmaxMax1;

	  if(TrendMid > 0 && SminMid0 < SminMid1)
	                               SminMid0 = SminMid1;
	  if(TrendMid < 0 && SmaxMid0 > SmaxMid1)
	                               SmaxMid0 = SmaxMid1;
	  //----
	  if (TrendMin > 0)
	            linemin = SminMin0 + SizeMin;
	  if (TrendMin < 0)
	            linemin = SmaxMin0 - SizeMin;

	  if (TrendMax > 0)
	            linemax = SminMax0 + SizeMax;
	  if (TrendMax < 0)
	            linemax = SmaxMax0 - SizeMax;

	  if (TrendMid > 0)
	            linemid = SminMid0 + SizeMid;
	  if (TrendMid < 0)
	            linemid = SmaxMid0 - SizeMid;
	  //----
	  bsmin = linemax - SizeMax;
	  bsmax = linemax + SizeMax;
	  //----
	  Stoch1 = (linemin - bsmin) / (bsmax - bsmin);
	  Stoch2 = (linemid - bsmin) / (bsmax - bsmin);
	  //----
	  LineMinBuffer[bar] = Stoch1;
	  LineMidBuffer[bar] = Stoch2;
	  //----
	  SminMin1 = SminMin0;
	  SmaxMin1 = SmaxMin0;
	  //----
	  SminMax1 = SminMax0;
	  SmaxMax1 = SmaxMax0;
	  //----
	  SminMid1 = SminMid0;
	  SmaxMid1 = SmaxMid0;
	 }
	return(0);
 }
//+---+ +X----------------------------------------------------------X+
Comments