ScalperSignal_v1.01
Download script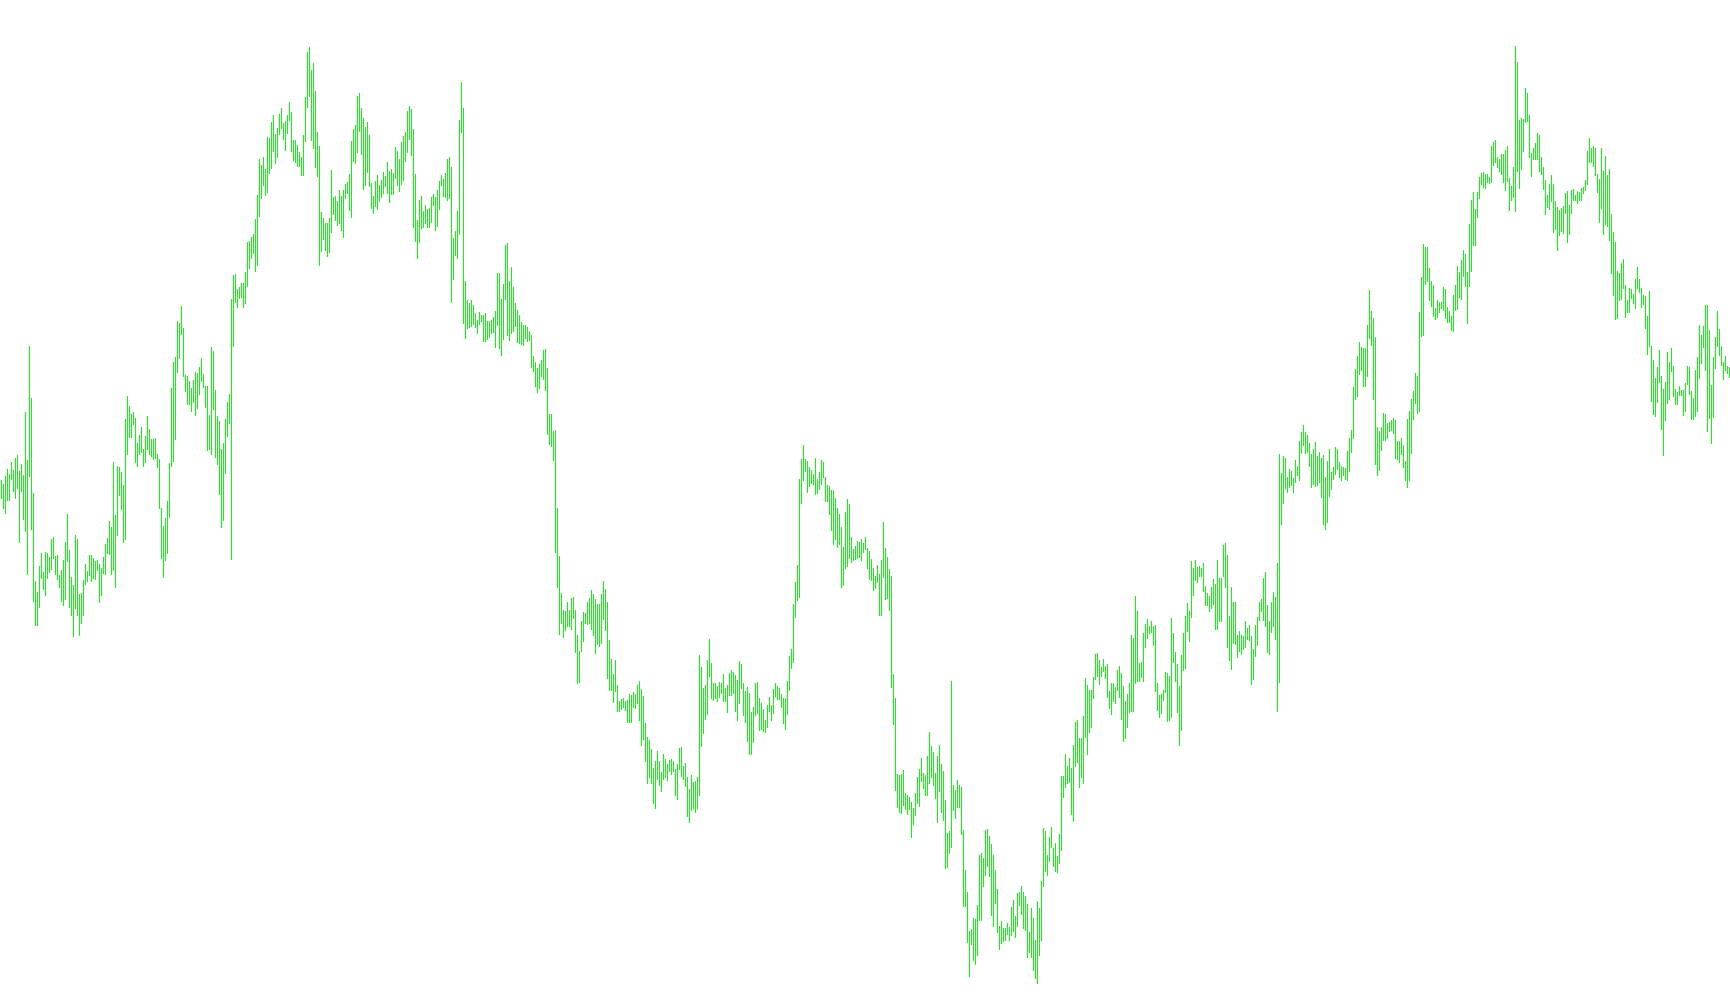
This script is designed as a visual trading assistant for MetaTrader, specifically tailored for "scalping"—a style of trading that focuses on capturing small, quick price movements. Its primary purpose is to identify specific patterns in price action and provide clear visual cues on your chart to help highlight potential entry points for buy and sell positions.
How the Logic Works
The script functions by scanning historical price data and comparing the relationship between consecutive bars (candles). It looks for specific structural breakdowns or breakouts based on two main components:
1. Trend Sensitivity Filtering One of the key features of this tool is a "Sensitivity" setting. The script uses this to determine how much historical context it should consider before issuing a signal. By analyzing a sequence of previous bars, it checks if the market is showing a consistent trend or moving in a way that might invalidate a quick trade. High sensitivity ensures the script is more cautious by verifying multiple previous price points, while lower sensitivity allows for faster, more aggressive signal generation.
2. Signal Detection (Buy and Sell) The core logic triggers signals based on how the current price interacts with the "Highs" and "Lows" of a specific previous candle:
- Sell Signals: The script looks for instances where the price drops significantly below the high and low boundaries of a previous candle. If the market shows a specific downward momentum while passing through these levels, it marks a potential sell point.
- Buy Signals: Conversely, the script monitors for upward movements. When the price closes above the highs and lows of a prior candle, signifying a breakout in strength, it identifies a potential buy opportunity.
Visual Representation on Your Chart
Instead of just providing raw numbers, the script translates its logic into clear visual elements:
- Arrows: When a buy or sell condition is met, the script places distinct arrows on your chart. This allows you to see exactly where the logic suggests an entry occurred.
- Highs and Lows: The script also draws white histogram lines that track the high and low boundaries of the price action. These act as visual "walls," helping you see the price levels that the script is using to make its calculations.
In summary, this tool automates the process of identifying price breakouts by monitoring how current prices interact with previous candles, filtering those movements through a user-defined sensitivity level to help traders spot quick opportunities in fast-moving markets.
//ScalperSignal_v1.01
#property copyright "Copyright © 2007, NiX @ www.forex-tsd.com"
#property link      "http://www.forex-tsd.com"

#property indicator_chart_window
#property indicator_buffers 4
#property indicator_color1 White
#property indicator_color2 White
#property indicator_color3 LightGreen
#property indicator_color4 Red

extern int CountBars = 300;
extern string FS = " ** Filter sensitivity: High <-[1..4]-> Low ** ";
extern int Sensitivity = 2;//2
extern int bar = 3;//3

double bufer1[];
double bufer2[];
double bufer3[];
double bufer4[];

int init() {
   IndicatorBuffers(4);
   SetIndexStyle(2, DRAW_ARROW);
   SetIndexArrow(2, 233);
   SetIndexBuffer(2, bufer1);
   SetIndexStyle(3, DRAW_ARROW);
   SetIndexArrow(3, 234);
   SetIndexBuffer(3, bufer2);
   SetIndexStyle(0, DRAW_HISTOGRAM, STYLE_SOLID, 3, White);
   SetIndexBuffer(0, bufer3);
   SetIndexStyle(1, DRAW_HISTOGRAM, STYLE_SOLID, 3, White);
   SetIndexBuffer(1, bufer4);
   SetIndexEmptyValue(0, 0);
   SetIndexEmptyValue(1, 0);
   SetIndexEmptyValue(2, 0);
   SetIndexEmptyValue(3, 0);
   SetIndexLabel(2, "Buy Signal");
   SetIndexLabel(3, "Sell Signal");
   SetIndexLabel(0, "High");
   SetIndexLabel(1, "Low");
   SetIndexEmptyValue(0, EMPTY_VALUE);
   SetIndexEmptyValue(1, EMPTY_VALUE);
   SetIndexEmptyValue(2, EMPTY_VALUE);
   SetIndexEmptyValue(3, EMPTY_VALUE);
   string Name = "Scalper Signal";
   IndicatorShortName(Name);
   if (Sensitivity < 1) Sensitivity = 1;
   if (Sensitivity > 3) Sensitivity = 3;
   return (0);
}

int deinit() {
   return (0);
}

double sellSignal(int shift) {
   bool limit = TRUE;
   if (Sensitivity > 3)
      if (iHigh(Symbol(), Period(), shift + 7) >= iHigh(Symbol(), Period(), shift + 6)) limit = FALSE;
   if (Sensitivity > 2)
      if (iHigh(Symbol(), Period(), shift + 6) >= iHigh(Symbol(), Period(), shift + 5)) limit = FALSE;
   if (Sensitivity > 1)
      if (iHigh(Symbol(), Period(), shift + 5) >= iHigh(Symbol(), Period(), shift + 4)) limit = FALSE;
   if (Sensitivity > 0)
      if (iHigh(Symbol(), Period(), shift + 4) >= iHigh(Symbol(), Period(), shift + 3)) limit = FALSE;
   if (limit) {
      if (iClose(Symbol(), Period(), shift + 2) < iHigh(Symbol(), Period(), shift + 3))
      if (iClose(Symbol(), Period(), shift + 1) < iLow(Symbol(), Period(), shift + 3)) return (iLow(Symbol(), Period(), shift + 3) - 10.0 * Point);
   }
   return (0);
}

double buySignal(int shift) {
   bool limit = TRUE;
   if (Sensitivity > 3)
      if (iLow(Symbol(), Period(), shift + 7) <= iLow(Symbol(), Period(), shift + 6)) limit = FALSE;
   if (Sensitivity > 2)
      if (iLow(Symbol(), Period(), shift + 6) <= iLow(Symbol(), Period(), shift + 5)) limit = FALSE;
   if (Sensitivity > 1)
      if (iLow(Symbol(), Period(), shift + 5) <= iLow(Symbol(), Period(), shift + 4)) limit = FALSE;
   if (Sensitivity > 0)
      if (iLow(Symbol(), Period(), shift + 4) <= iLow(Symbol(), Period(), shift + 3)) limit = FALSE;
   if (limit) {
      if (iClose(Symbol(), Period(), shift + 2) > iLow(Symbol(), Period(), shift + 3))
      if (iClose(Symbol(), Period(), shift + 1) > iHigh(Symbol(), Period(), shift + 3)) return (iHigh(Symbol(), Period(), shift + 3) + 10.0 * Point);
   }
   return (0);
}

int start() {
   int counted_bars = IndicatorCounted();
   if (counted_bars < 0) return (-1);
   if (counted_bars > 0) counted_bars--;
   int limit = Bars - counted_bars;
   for (int i = 0; i < limit; i++) {
      bufer1[i + bar] = buySignal(i);
      bufer2[i + bar] = sellSignal(i);
      if (buySignal(i) > 0.0 || sellSignal(i) > 0.0) {
         bufer3[i + bar] = iHigh(Symbol(), Period(), i + bar);
         bufer4[i + bar] = iLow(Symbol(), Period(), i + bar);
      }
   }
return (0);}
Comments