QuickMA
Download script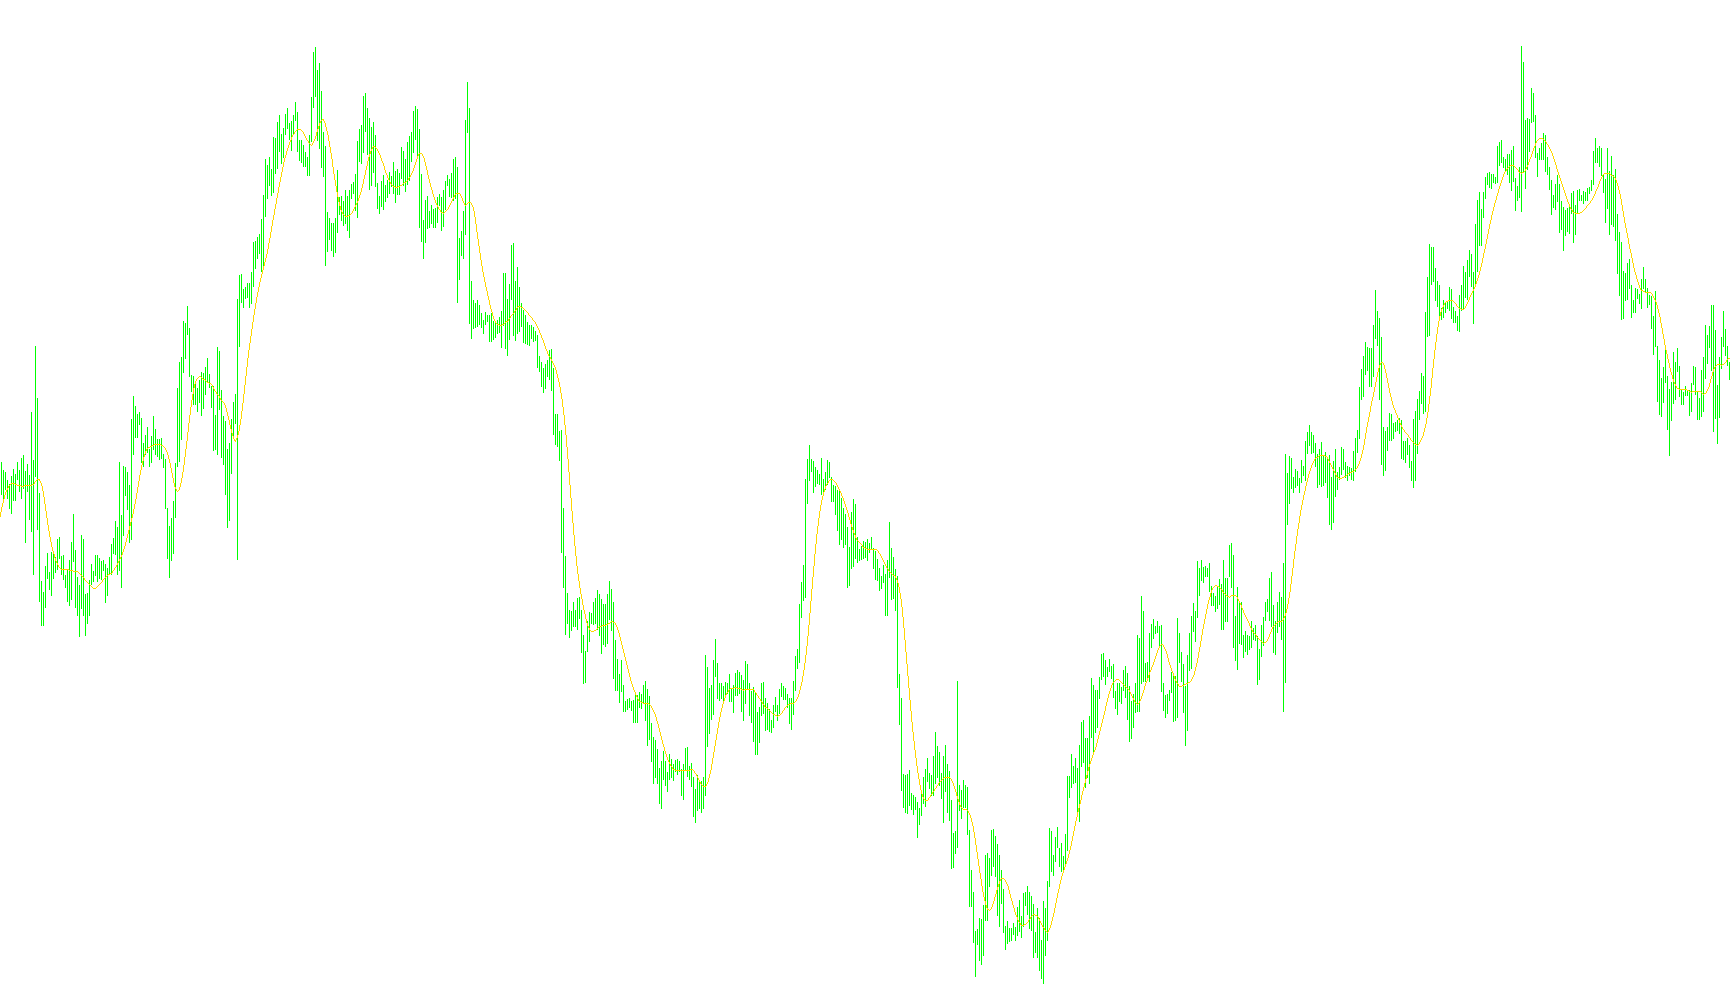
This custom indicator is designed to provide a smoother, more responsive visual representation of price trends on a trading chart. Unlike standard moving averages that weigh all data points equally, this script utilizes a weighted calculation method to better reflect the most relevant market information.
Core Logic Overview
The primary goal of this tool is to calculate an average price over a specific period (defined by the "Length" setting). However, instead of a simple linear average, it applies a mathematical distribution known as a weighted distribution.
How It Works
To determine the current value on your chart, the script performs the following logic:
- Weighting Distribution: The tool looks at the price data within the chosen timeframe and assigns "weights" to each data point. It treats the middle of the time period as the most significant area.
- Symmetrical Calculation: The weight increases as it approaches the center of the selected period and decreases toward the edges. This means that the data points closest to the current moment (and those just slightly preceding it) have a greater influence on the final result than older data.
- Smoothing Effect: By prioritizing these weights, the indicator filters out minor market "noise" while remaining sensitive enough to react quickly to actual trend changes. It aims to provide a curved, flowing line that helps traders identify the direction of the market more clearly.
- Customizable Inputs: Users can adjust three primary factors to suit their trading style:
- Length: Determines how many past candles are included in the calculation.
- Shift: Allows the user to move the visual line forward or backward on the chart.
- Price: Defines which price point (such as the Closing Price) should be used as the basis for the average.
Summary for Traders
In practical terms, this script acts as a refined trend-following tool. Because it weights the data symmetrically, it produces a smoother line than a standard Simple Moving Average (SMA). It is intended to help traders see the "momentum" of the market by emphasizing recent price action while still acknowledging the context of the preceding price history.
//+------------------------------------------------------------------+
//|                                                      QuickMA.mq4 |
//|                                                           mladen |
//|                                                                  |
//| original (tradestation version) by John McCormick, 2008          |
//+------------------------------------------------------------------+
#property copyright "mladen"
#property link      "mladenfx@gmail.com"

#property indicator_chart_window
#property indicator_buffers 1
#property indicator_color1 Red

//
//
//
//
//

extern int  Length  = 14;
extern int  Shift   = 0;
extern int  Price   = PRICE_CLOSE;

//
//
//
//
//

double buffer1[];


//+------------------------------------------------------------------+
//|                                                                  |
//+------------------------------------------------------------------+
//
//
//
//
//

int init()
{
   SetIndexBuffer(0,buffer1); SetIndexShift(0,Shift);
   return(0);
}
int deinit() { return(0); }

//+------------------------------------------------------------------+
//|                                                                  |
//+------------------------------------------------------------------+
//
//
//
//
//

int start()
{
   int counted_bars=IndicatorCounted();
   int i,limit;

   if(counted_bars<0) return(-1);
   if(counted_bars>0) counted_bars--;
         limit = Bars-counted_bars;

   //
   //
   //
   //
   //

   for(i=limit; i>=0; i--)
   {
      double sum     = 0;
      double divisor = 0;
      double peak    = Length/3.0;

      //
      //
      //
      //
      //

      for(int k=1; k<=(Length+1); k++)
      {
         double val;
            if(k <= peak)
                  val = k/peak;
            else  val = (Length+1-k)/(Length+1-peak);
            sum     += iMA(NULL,0,1,0,MODE_SMA,Price,i+k-1)*val;
            divisor += val;
      }
      if (divisor!=0)
            buffer1[i] = sum/divisor;
      else  buffer1[i] = 0;
   }

   //
   //
   //
   //
   //

   return(0);
}
Comments