FiboPiv_v3_v1
Download script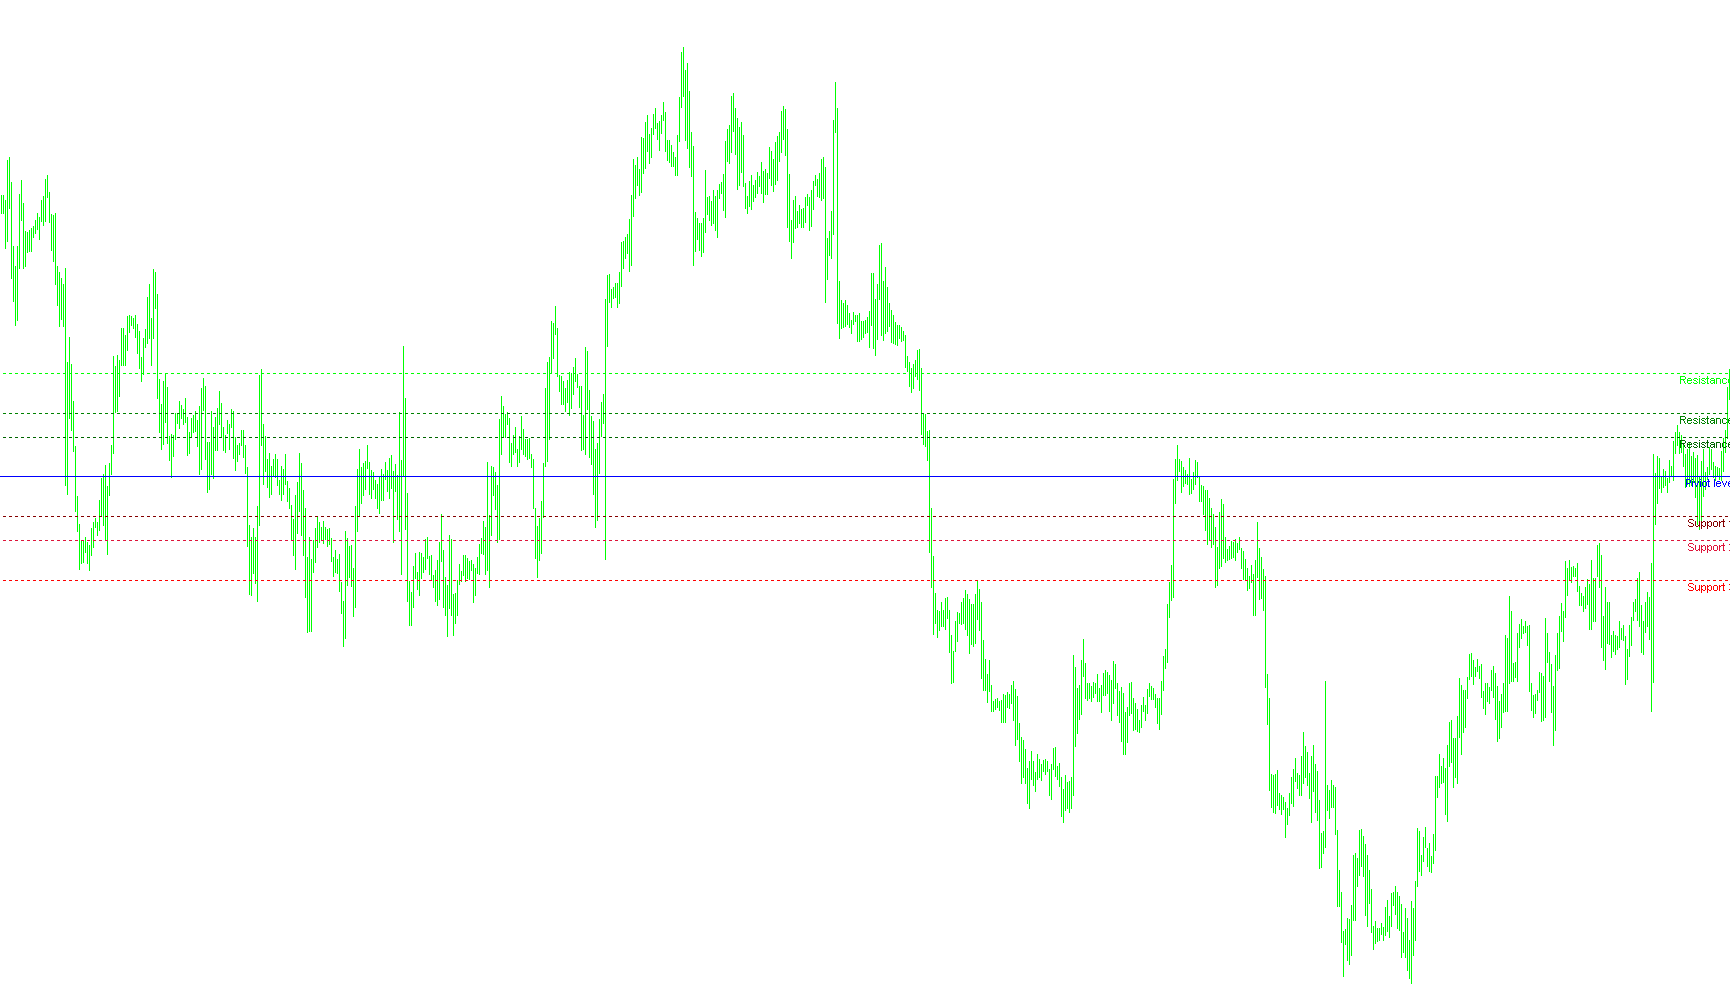
This script is a technical analysis tool designed to automatically identify and plot key price levels on your trading chart. It utilizes a combination of "Pivot Point" calculations and "Fibonacci" ratios to help traders visualize potential areas of support and resistance where the market might react or change direction.
Core Logic and Functionality
1. Data Gathering & Market Context The script begins by analyzing historical price data from the previous trading day. It specifically looks for three key pieces of information: the High, the Low, and the Close price.
A notable feature of this logic is its ability to handle weekends. If the current market day is a Monday, the script intelligently searches backward to find the data from the most recent Friday, ensuring that the calculated levels remain relevant even after a market break.
2. Calculation Methodology Once the previous day's prices are identified, the script performs three primary types of calculations:
- The Range: It calculates the total distance between the previous day's High and Low.
- The Pivot Point: It establishes a central "mean" price by averaging the previous day's High, Low, and Close. This serves as the main baseline for the day's sentiment.
- Support and Resistance Levels: Using the Range and the Pivot Point, the script generates six specific levels:
- Resistance (R1, R2, R3): These are calculated above the Pivot Point. They represent price ceilings where selling pressure might increase. The script uses specific multipliers (0.382, 0.618, and 1.000) to determine these zones.
- Support (S1, S2, S3): These are calculated below the Pivot Point. They represent price floors where buying interest might emerge. Like the resistance levels, these are also derived using Fibonacci-based multipliers.
3. Visual Presentation The script automates the visual layout of your chart by performing the following actions:
- Dynamic Drawing: It automatically draws horizontal lines across the chart for all six support/resistance levels plus the central Pivot line.
- Styling: The Pivot Point is highlighted with a solid line to distinguish it as the primary balance point, while the Support and Resistance levels are drawn as dotted lines to provide a clean, uncluttered view.
- Labeling: Each line is accompanied by a clear text label (e.g., "Resistance 1", "Support 2") and assigned specific colors. This allows traders to immediately identify which level is which at a glance.
- Real-time Updates: The script is designed to refresh these levels automatically, ensuring that as the market moves, the lines stay accurately positioned based on the most recent completed trading session.
Summary for the Trader In essence, this tool removes the manual work of calculating price boundaries. It takes yesterday's market performance and projects a "roadmap" onto today's chart, highlighting the most mathematically significant areas where the price is likely to encounter friction or momentum shifts.
//+------------------------------------------------------------------+
//|                                                   FiboPiv_v1.mq4 |
//|                                                          Kalenzo |
//|                                      bartlomiej.gorski@gmail.com |
//+------------------------------------------------------------------+
#property copyright "Kalenzo"
#property link      "bartlomiej.gorski@gmail.com"
extern color Resistance_3 = Lime;
extern color Resistance_2 = Green;
extern color Resistance_1 = DarkGreen;
extern color Piviot = Blue;
extern color Support_1 = Maroon;
extern color Support_2 = Crimson;
extern color Support_3 = Red;
#property indicator_chart_window
//+------------------------------------------------------------------+
//| Custom indicator initialization function                         |
//+------------------------------------------------------------------+
int init()
  {
//---- indicators
//----
   return(0);
  }
//+------------------------------------------------------------------+
//| Custom indicator deinitialization function                       |
//+------------------------------------------------------------------+
int deinit()
  {
//----
   ObjectDelete("S1");
   ObjectDelete("S2");
   ObjectDelete("S3");
   ObjectDelete("R1");
   ObjectDelete("R2");
   ObjectDelete("R3");
   ObjectDelete("PIVIOT");
   ObjectDelete("Support 1");
   ObjectDelete("Support 2");
   ObjectDelete("Support 3");
   ObjectDelete("Piviot level");
   ObjectDelete("Resistance 1");
   ObjectDelete("Resistance 2");
   ObjectDelete("Resistance 3");
   Comment(" ");
//----
   return(0);
  }
//+------------------------------------------------------------------+
//| Custom indicator iteration function                              |
//+------------------------------------------------------------------+
int start()
  {

//----
double rates[1][6],yesterday_close,yesterday_high,yesterday_low;
ArrayCopyRates(rates, Symbol(), PERIOD_D1);

if(DayOfWeek() == 1)
{
   if(TimeDayOfWeek(iTime(Symbol(),PERIOD_D1,1)) == 5)
   {
       yesterday_close = rates[1][4];
       yesterday_high = rates[1][3];
       yesterday_low = rates[1][2];
   }
   else
   {
      for(int d = 5;d>=0;d--)
      {
         if(TimeDayOfWeek(iTime(Symbol(),PERIOD_D1,d)) == 5)
         {
             yesterday_close = rates[d][4];
             yesterday_high = rates[d][3];
             yesterday_low = rates[d][2];
         }

      }

   }
}
else
{
    yesterday_close = rates[1][4];
    yesterday_high = rates[1][3];
    yesterday_low = rates[1][2];
}


//---- Calculate Pivots

Comment("\nYesterday quotations:\nH ",yesterday_high,"\nL ",yesterday_low, "\nC ",yesterday_close);
double R = yesterday_high - yesterday_low;//range
double p = (yesterday_high + yesterday_low + yesterday_close)/3;// Standard Pivot
double r3 = p + (R * 1.000);
double r2 = p + (R * 0.618);
double r1 = p + (R * 0.382);
double s1 = p - (R * 0.382);
double s2 = p - (R * 0.618);
double s3 = p - (R * 1.000);

drawLine(r3,"R3", Resistance_3,0);
drawLabel("Resistance 3",r3,Resistance_3);
drawLine(r2,"R2", Resistance_2,0);
drawLabel("Resistance 2",r2,Resistance_2);
drawLine(r1,"R1", Resistance_1,0);
drawLabel("Resistance 1",r1,Resistance_1);

drawLine(p,"PIVIOT",Piviot,1);
drawLabel("Piviot level",p,Piviot);

drawLine(s1,"S1",Support_1,0);
drawLabel("Support 1",s1,Support_1);
drawLine(s2,"S2",Support_2,0);
drawLabel("Support 2",s2,Support_2);
drawLine(s3,"S3",Support_3,0);
drawLabel("Support 3",s3,Support_3);


//----
   return(0);
  }
//+------------------------------------------------------------------+
void drawLabel(string name,double lvl,color Color)
{
    if(ObjectFind(name) != 0)
    {
        ObjectCreate(name, OBJ_TEXT, 0, Time[10], lvl);
        ObjectSetText(name, name, 8, "Arial", EMPTY);
        ObjectSet(name, OBJPROP_COLOR, Color);
    }
    else
    {
        ObjectMove(name, 0, Time[10], lvl);
    }
}


void drawLine(double lvl,string name, color Col,int type)
{
         if(ObjectFind(name) != 0)
         {
            ObjectCreate(name, OBJ_HLINE, 0, Time[0], lvl,Time[0],lvl);

            if(type == 1)
            ObjectSet(name, OBJPROP_STYLE, STYLE_SOLID);
            else
            ObjectSet(name, OBJPROP_STYLE, STYLE_DOT);

            ObjectSet(name, OBJPROP_COLOR, Col);
            ObjectSet(name,OBJPROP_WIDTH,1);

         }
         else
         {
            ObjectDelete(name);
            ObjectCreate(name, OBJ_HLINE, 0, Time[0], lvl,Time[0],lvl);

            if(type == 1)
            ObjectSet(name, OBJPROP_STYLE, STYLE_SOLID);
            else
            ObjectSet(name, OBJPROP_STYLE, STYLE_DOT);

            ObjectSet(name, OBJPROP_COLOR, Col);
            ObjectSet(name,OBJPROP_WIDTH,1);

         }
}
Comments