FiboPiv_v2
Download script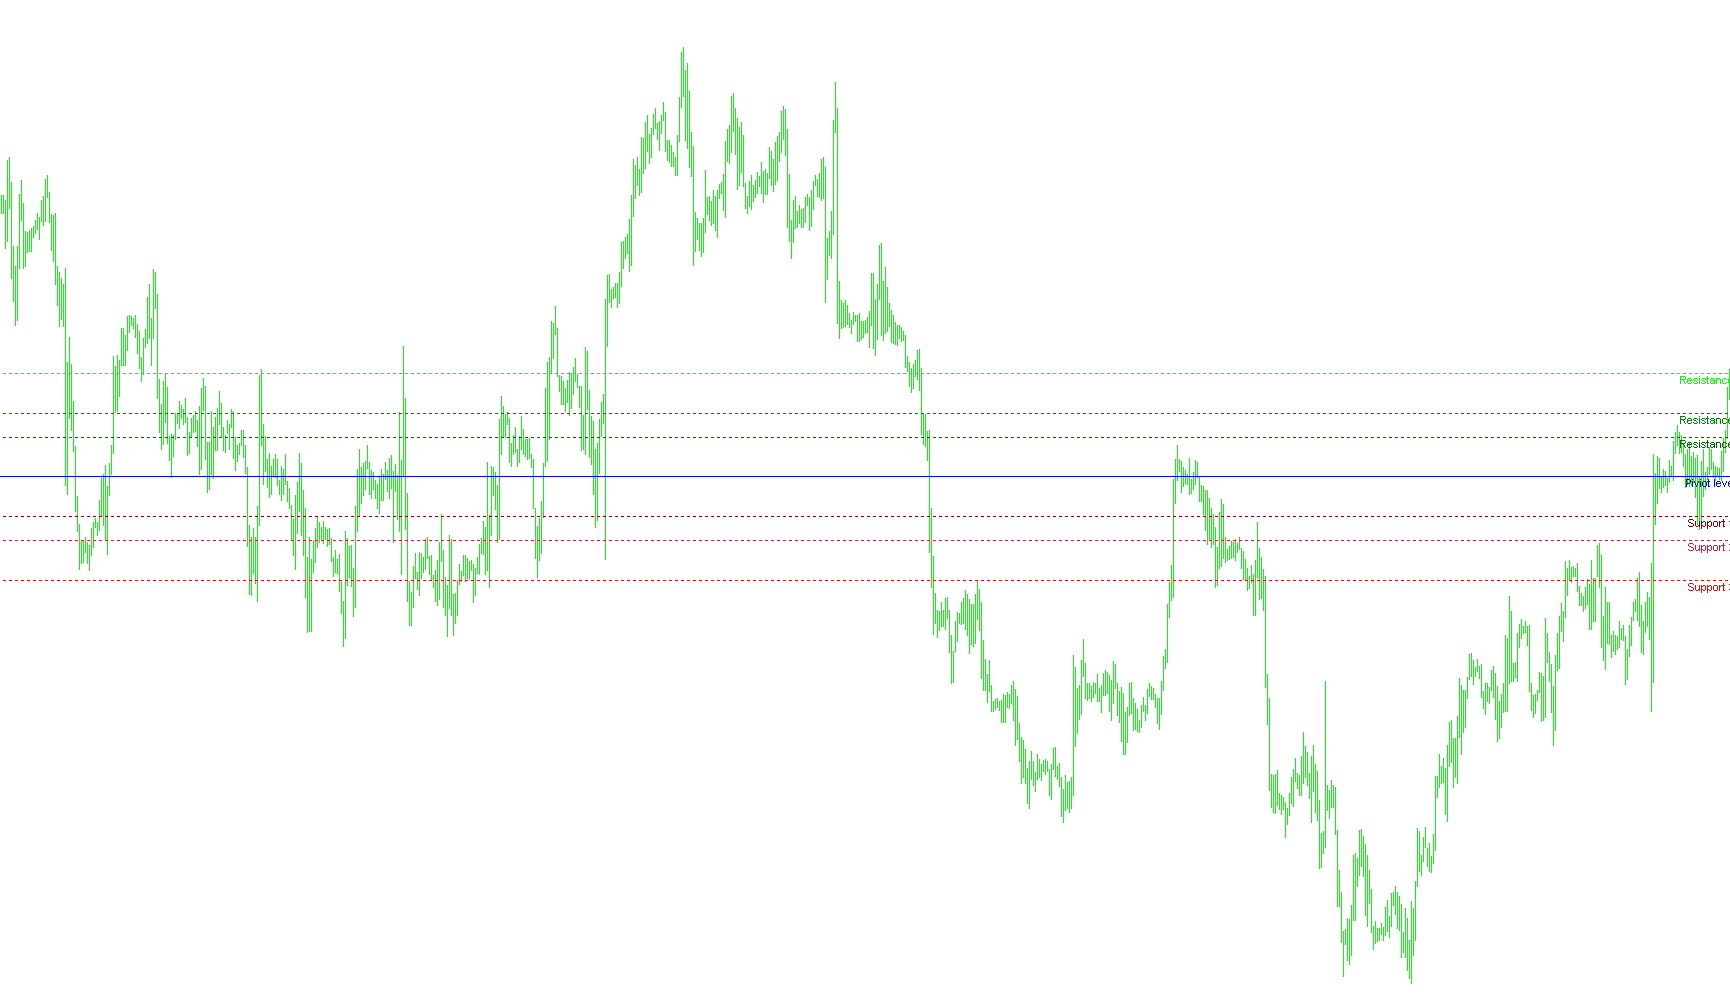
This tool is designed to automatically project key price levels onto your trading chart based on historical market activity. By identifying where the price has behaved significantly in the past, it helps traders visualize potential "ceilings" (resistance) and "floors" (support) to better plan their entries and exits.
How the Logic Works
1. Data Gathering The script begins by looking back at yesterday's market performance. It specifically identifies three critical price points from the previous trading day:
- The High: The highest price reached.
- The Low: The lowest price reached.
- The Close: The final price at which the market ended.
To ensure accuracy, the script includes a smart check for weekends. If the market opens on a Monday, it automatically searches back to find the last valid Friday of trading to ensure the data is consistent and relevant.
2. Calculating the Pivot Point Once it has yesterday's data, the script calculates a "Pivot Level." This is the mathematical average of yesterday’s High, Low, and Close. Think of this as the "equilibrium" price for the current day; prices trading above it are often considered bullish, while prices below it are considered bearish.
3. Projecting Support and Resistance Levels Beyond the central Pivot Level, the script uses the range (the distance between yesterday’s high and low) combined with specific mathematical ratios to project seven distinct levels on your chart:
- Resistance Levels (R1, R2, R3): These are projected above the Pivot Point. They represent areas where selling pressure might increase, potentially preventing the price from rising further.
- Support Levels (S1, S2, S3): These are projected below the Pivot Point. They represent areas where buying interest might cluster, potentially preventing the price from falling further.
4. Visual Representation The script automatically draws these levels as horizontal lines and labels them clearly on your screen:
- The Pivot Level is highlighted with a solid line to serve as your primary anchor.
- The Support and Resistance lines are drawn as dotted lines, providing a clear visual guide of the "zones" to watch throughout the trading session.
Summary for Traders
Essentially, this script removes the manual guesswork of calculating price boundaries. It takes the previous day's volatility and mathematically maps out a roadmap for the current day, showing you exactly where the market's historical "turning points" are likely to occur.
//+------------------------------------------------------------------+
//|                                                   FiboPiv_v1.mq4 |
//|                                                          Kalenzo |
//|                                      bartlomiej.gorski@gmail.com |
//+------------------------------------------------------------------+
#property copyright "Kalenzo"
#property link      "bartlomiej.gorski@gmail.com"

#property indicator_chart_window
//+------------------------------------------------------------------+
//| Custom indicator initialization function                         |
//+------------------------------------------------------------------+
int init()
  {
//---- indicators
//----
   return(0);
  }
//+------------------------------------------------------------------+
//| Custom indicator deinitialization function                       |
//+------------------------------------------------------------------+
int deinit()
  {
//----
   ObjectDelete("S1");
   ObjectDelete("S2");
   ObjectDelete("S3");
   ObjectDelete("R1");
   ObjectDelete("R2");
   ObjectDelete("R3");
   ObjectDelete("PIVIOT");
   ObjectDelete("Support 1");
   ObjectDelete("Support 2");
   ObjectDelete("Support 3");
   ObjectDelete("Piviot level");
   ObjectDelete("Resistance 1");
   ObjectDelete("Resistance 2");
   ObjectDelete("Resistance 3");
   Comment(" ");
//----
   return(0);
  }
//+------------------------------------------------------------------+
//| Custom indicator iteration function                              |
//+------------------------------------------------------------------+
int start()
  {

//----
double rates[1][6],yesterday_close,yesterday_high,yesterday_low;
ArrayCopyRates(rates, Symbol(), PERIOD_D1);

if(DayOfWeek() == 1)
{
   if(TimeDayOfWeek(iTime(Symbol(),PERIOD_D1,1)) == 5)
   {
       yesterday_close = rates[1][4];
       yesterday_high = rates[1][3];
       yesterday_low = rates[1][2];
   }
   else
   {
      for(int d = 5;d>=0;d--)
      {
         if(TimeDayOfWeek(iTime(Symbol(),PERIOD_D1,d)) == 5)
         {
             yesterday_close = rates[d][4];
             yesterday_high = rates[d][3];
             yesterday_low = rates[d][2];
         }

      }
   }
}
else
{
    yesterday_close = rates[1][4];
    yesterday_high = rates[1][3];
    yesterday_low = rates[1][2];
}


//---- Calculate Pivots

Comment("\nYesterday quotations:\nH ",yesterday_high,"\nL ",yesterday_low, "\nC ",yesterday_close);
double R = yesterday_high - yesterday_low;//range
double p = (yesterday_high + yesterday_low + yesterday_close)/3;// Standard Pivot
double r3 = p + (R * 1.000);
double r2 = p + (R * 0.618);
double r1 = p + (R * 0.382);
double s1 = p - (R * 0.382);
double s2 = p - (R * 0.618);
double s3 = p - (R * 1.000);

drawLine(r3,"R3", Lime,0);
drawLabel("Resistance 3",r3,Lime);
drawLine(r2,"R2", Green,0);
drawLabel("Resistance 2",r2,Green);
drawLine(r1,"R1", DarkGreen,0);
drawLabel("Resistance 1",r1,DarkGreen);

drawLine(p,"PIVIOT",Blue,1);
drawLabel("Piviot level",p,Blue);

drawLine(s1,"S1",Maroon,0);
drawLabel("Support 1",s1,Maroon);
drawLine(s2,"S2",Crimson,0);
drawLabel("Support 2",s2,Crimson);
drawLine(s3,"S3",Red,0);
drawLabel("Support 3",s3,Red);


//----
   return(0);
  }
//+------------------------------------------------------------------+
void drawLabel(string name,double lvl,color Color)
{
    if(ObjectFind(name) != 0)
    {
        ObjectCreate(name, OBJ_TEXT, 0, Time[10], lvl);
        ObjectSetText(name, name, 8, "Arial", EMPTY);
        ObjectSet(name, OBJPROP_COLOR, Color);
    }
    else
    {
        ObjectMove(name, 0, Time[10], lvl);
    }
}


void drawLine(double lvl,string name, color Col,int type)
{
         if(ObjectFind(name) != 0)
         {
            ObjectCreate(name, OBJ_HLINE, 0, Time[0], lvl,Time[0],lvl);

            if(type == 1)
            ObjectSet(name, OBJPROP_STYLE, STYLE_SOLID);
            else
            ObjectSet(name, OBJPROP_STYLE, STYLE_DOT);

            ObjectSet(name, OBJPROP_COLOR, Col);
            ObjectSet(name,OBJPROP_WIDTH,1);

         }
         else
         {
            ObjectDelete(name);
            ObjectCreate(name, OBJ_HLINE, 0, Time[0], lvl,Time[0],lvl);

            if(type == 1)
            ObjectSet(name, OBJPROP_STYLE, STYLE_SOLID);
            else
            ObjectSet(name, OBJPROP_STYLE, STYLE_DOT);

            ObjectSet(name, OBJPROP_COLOR, Col);
            ObjectSet(name,OBJPROP_WIDTH,1);

         }
}
Comments