FiboPiv_v2_004
Download script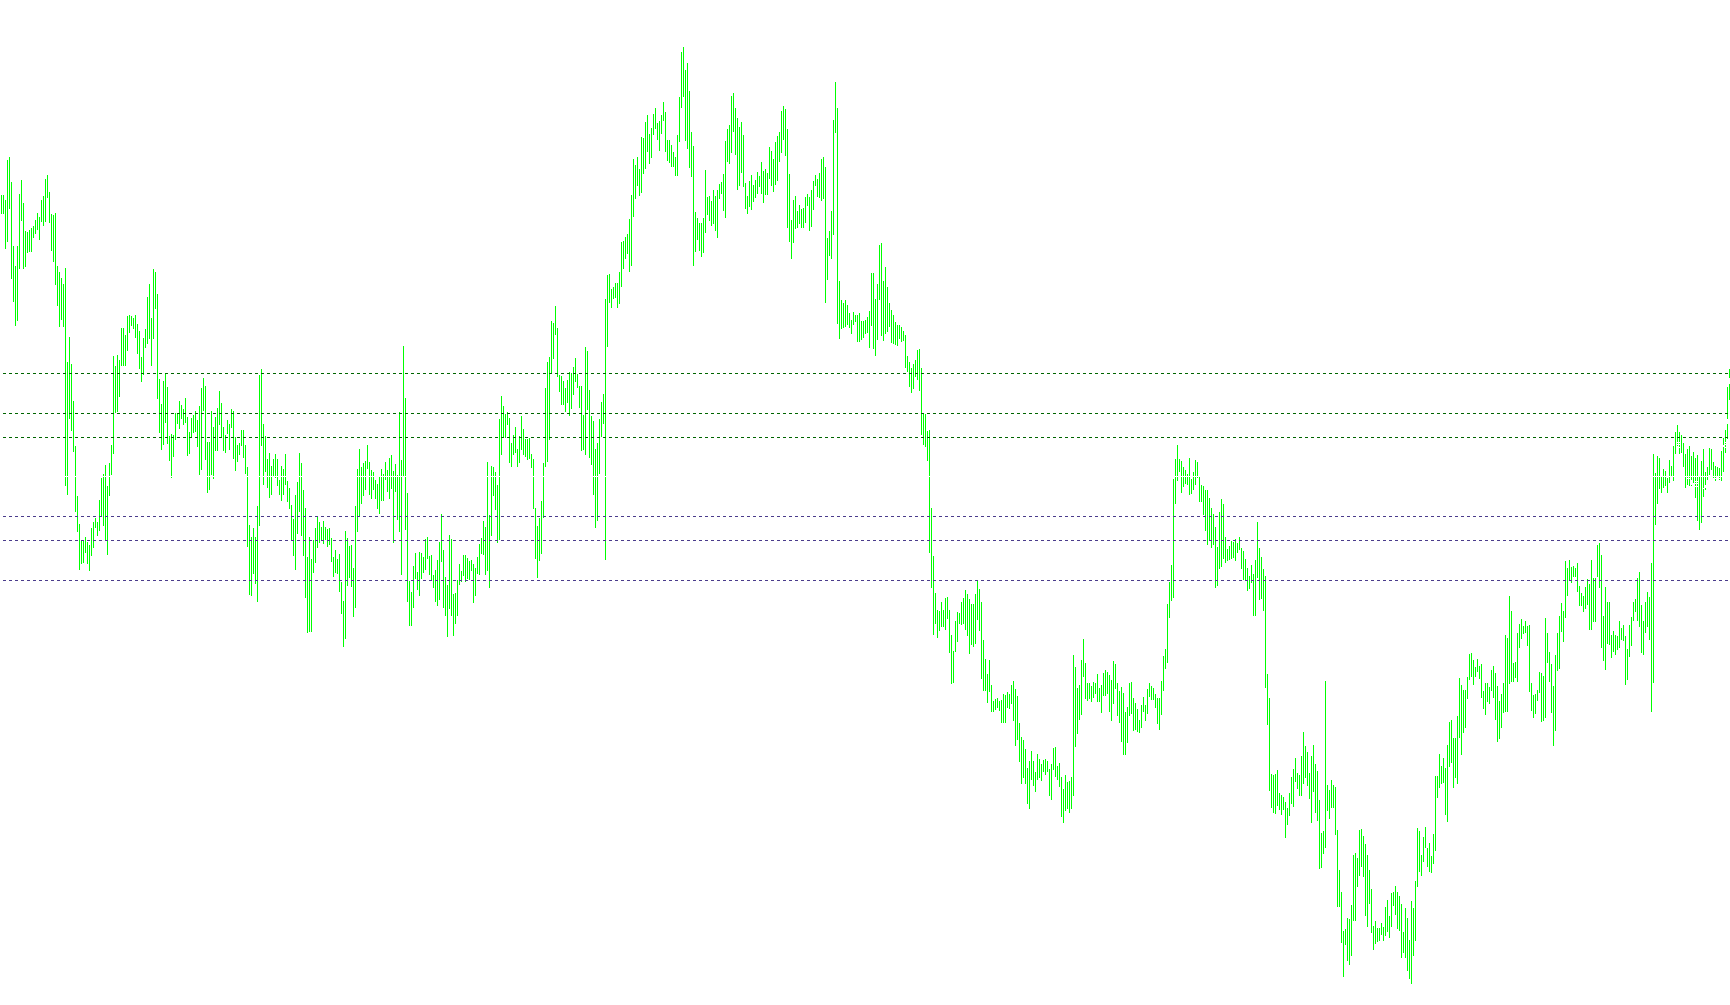
The FiboPiv_v1 indicator is a technical analysis tool designed to automatically identify and plot key price levels on your trading chart. It uses a combination of traditional "Pivot Point" logic and Fibonacci retracement ratios to help traders visualize potential areas of support and resistance for the current trading day.
How the Logic Works
The indicator functions by analyzing historical price data from the previous completed trading session to project significant levels onto the current chart. Here is a breakdown of its operational steps:
1. Data Retrieval & Market Context The script begins by scanning the daily price history. It specifically looks for three critical pieces of information from the previous day:
- The High price reached.
- The Low price reached.
- The Closing price.
It features an intelligent "weekend logic" check; if the current market day falls on a Monday, the script is designed to look back and find the most recent Friday's data to ensure the levels remain accurate even when markets are closed over the weekend.
2. Core Calculations Once it has the previous day's High, Low, and Close, it performs two primary sets of calculations:
- The Pivot Point: This is the central "balance" point for the day, calculated by taking the average of the previous day's High, Low, and Close.
- The Trading Range: It determines the total distance between the previous day’s high and low to establish the volatility scale for the current day.
3. Fibonacci & Resistance Mapping The script then projects six specific levels based on that trading range:
- Resistance Levels (R1, R2, R3): These are projected above the Pivot Point. They represent potential "ceilings" where price might struggle to move higher. The script uses specific Fibonacci-inspired multipliers (0.382, 0.618, and 1.000) to determine these distances.
- Support Levels (S1, S2, S3): These are projected below the Pivot Point. They represent potential "floors" where price might find buying interest. Similarly, these are mapped using the same Fibonacci ratios.
Visual Presentation on Your Chart
The indicator automatically handles all the drawing for you:
- Dynamic Lines: It draws horizontal lines across your chart representing the Support and Resistance levels. The Pivot Point is highlighted with a distinct solid line to separate the "bullish" and "bearish" zones.
- Automatic Labeling: Each level is clearly labeled on your screen (e.g., "Daily Resistance 1," "Daily Support 2") so you can identify them at a glance without needing to guess which line corresponds to which calculation.
- Real-time Updates: The script constantly monitors the price data, ensuring that as new daily information becomes available, the levels are updated and rendered correctly on your workspace.
By using this tool, you can quickly see where the market is mathematically "expected" to react based on yesterday's volatility, allowing for better planning of entry and exit points.
//+------------------------------------------------------------------+
//|                                                   FiboPiv_v1.mq4 |
//|                                                          Kalenzo |
//|                                      bartlomiej.gorski@gmail.com |
//+------------------------------------------------------------------+
#property copyright "Kalenzo"
#property link      "bartlomiej.gorski@gmail.com"

#property indicator_chart_window
//+------------------------------------------------------------------+
//| Custom indicator initialization function                         |
//+------------------------------------------------------------------+
int init()
  {
//---- indicators
//----
   return(0);
  }
//+------------------------------------------------------------------+
//| Custom indicator deinitialization function                       |
//+------------------------------------------------------------------+
int deinit()
  {
//----
   ObjectDelete("S1");
   ObjectDelete("S2");
   ObjectDelete("S3");
   ObjectDelete("R1");
   ObjectDelete("R2");
   ObjectDelete("R3");
   ObjectDelete("PIVOT");
   ObjectDelete("Support 1");
   ObjectDelete("Support 2");
   ObjectDelete("Support 3");
   ObjectDelete("Pivot level");
   ObjectDelete("Resistance 1");
   ObjectDelete("Resistance 2");
   ObjectDelete("Resistance 3");
   Comment(" ");
//----
   return(0);
  }
//+------------------------------------------------------------------+
//| Custom indicator iteration function                              |
//+------------------------------------------------------------------+
int start()
  {

//----
double rates[1][6],yesterday_close,yesterday_high,yesterday_low;
ArrayCopyRates(rates, Symbol(), PERIOD_D1);

if(DayOfWeek() == 1)
{
   if(TimeDayOfWeek(iTime(Symbol(),PERIOD_D1,1)) == 5)
   {
       yesterday_close = rates[1][4];
       yesterday_high = rates[1][3];
       yesterday_low = rates[1][2];
   }
   else
   {
      for(int d = 5;d>=0;d--)
      {
         if(TimeDayOfWeek(iTime(Symbol(),PERIOD_D1,d)) == 5)
         {
             yesterday_close = rates[d][4];
             yesterday_high = rates[d][3];
             yesterday_low = rates[d][2];
         }

      }
   }
}
else
{
    yesterday_close = rates[1][4];
    yesterday_high = rates[1][3];
    yesterday_low = rates[1][2];
}


//---- Calculate Pivots

Comment("\nYesterday quotations:\nH ",yesterday_high,"\nL ",yesterday_low, "\nC ",yesterday_close);
double R = yesterday_high - yesterday_low;//range
double p = (yesterday_high + yesterday_low + yesterday_close)/3;// Standard Pivot
double r3 = p + (R * 1.000);
double r2 = p + (R * 0.618);
double r1 = p + (R * 0.382);
double s1 = p - (R * 0.382);
double s2 = p - (R * 0.618);
double s3 = p - (R * 1.000);

drawLine(r3,"R3", DarkGreen,0);
drawLabel("Daily Resistance 3",r3,White);
drawLine(r2,"R2", DarkGreen,0);
drawLabel("Daily Resistance 2",r2,White);
drawLine(r1,"R1", DarkGreen,0);
drawLabel("Daily Resistance 1",r1,White);

drawLine(p,"PIVOT",White,1);
drawLabel("Daily Pivot ",p,White);

drawLine(s1,"S1",DarkSlateBlue,0);
drawLabel("Daily Support 1",s1,White);
drawLine(s2,"S2",DarkSlateBlue,0);
drawLabel("Daily Support 2",s2,White);
drawLine(s3,"S3",DarkSlateBlue,0);
drawLabel("Daily Support 3",s3,White);


//----
   return(0);
  }
//+------------------------------------------------------------------+
void drawLabel(string name,double lvl,color Color)
{
    if(ObjectFind(name) != 0)
    {
        ObjectCreate(name, OBJ_TEXT, 0, Time[10], lvl);
        ObjectSetText(name, name, 8, "Lucida Handwriting", EMPTY);
        ObjectSet(name, OBJPROP_COLOR, Color);
    }
    else
    {
        ObjectMove(name, 0, Time[10], lvl);
    }
}


void drawLine(double lvl,string name, color Col,int type)
{
         if(ObjectFind(name) != 0)
         {
            ObjectCreate(name, OBJ_HLINE, 0, Time[0], lvl,Time[0],lvl);

            if(type == 1)
            ObjectSet(name, OBJPROP_STYLE, STYLE_SOLID);
            else
            ObjectSet(name, OBJPROP_STYLE, STYLE_DOT);

            ObjectSet(name, OBJPROP_COLOR, Col);
            ObjectSet(name,OBJPROP_WIDTH,1);

         }
         else
         {
            ObjectDelete(name);
            ObjectCreate(name, OBJ_HLINE, 0, Time[0], lvl,Time[0],lvl);

            if(type == 1)
            ObjectSet(name, OBJPROP_STYLE, STYLE_SOLID);
            else
            ObjectSet(name, OBJPROP_STYLE, STYLE_DOT);

            ObjectSet(name, OBJPROP_COLOR, Col);
            ObjectSet(name,OBJPROP_WIDTH,1);

         }
}
Comments